Introduction
 hat is a spectrograph good for? There are many times when we would like to collect
spectra from objects. The spectrum of a star or nebula can tell us what elements it
is made of, what its temperature is, and how fast it is moving away from us. The
near-infrared region of the solar spectrum is packed with telluric absorption lines
that tell us about the chemistry of water vapor and other gases in the atmosphere.
The spectrum of a lamp tells us the composition of a light source and the
light-absorbing materials between it and our camera. In short, as Rod
Serling might say, a spectrograph opens up an entirely new dimension of sight.
In principle a spectrograph is very simple: essentially it is a high-resolution monochromator attached to a camera. Although conceptually simple, building a good one is not trivial.
There are many designs for spectrographs on the Web. There are even books on the subject, like K.M. Harrison's Astronomical Spectroscopy for Amateurs [4]. Most of these use the time-tested Czerny-Turner or Littrow designs. They're easy to build and align and give pretty good results. But one day I came into possession of one of those fancy schmancy off-axis parabolic mirrors. It had far too much astigmatism from off-axis light to be useful as an ultraviolet catoptric lens, which was what I bought it for, so I wondered how well it would work in a spectrograph.
An excellent reference for the theory of gratings and their use in astrophysics is Spectrophysics, 2nd ed. by Thorne [6].
Lenses vs. mirrors
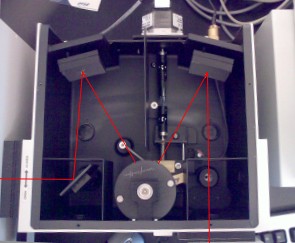 Czerny-Turner Monochromator in a PTI QM-4-CW fluorescence spectrometer.
The light path is traced in red.
Unlike lenses, mirrors have no chromatic aberration, which is a distinct advantage for a spectrograph. Mirrors also have the advantage of working in the UV, unlike glass lenses, which block everything below 330-340 nm, and camera lenses, which block everything below 400 nm or so, depending on how they're coated. See uv.html for more details and some spectra.
Most commercial monochromators use a Czerny-Turner configuration, where two identical spherical mirrors are arranged symmetrically in a Z-configuration to cancel each other's off-axis coma. These are easy to build, but their spherical aberration and astigmatism caused by the spherical mirrors are never completely eliminated. These aberrations cause the spectral lines to be curved and the image to be blurred, reducing resolution and sensitivity. A better solution is an off-axis parabolic mirror. The curved mirrors reflect their image at a fixed angle, allowing free access to the focal point. The paraboloidal shape eliminates spherical aberration.
Chupp and Grantz [3] showed that spherical mirrors work best in a W or Z configuration like the Czerny-Turner, while off-axis paraboloidal mirrors work better in a "U" configuration like the Littrow, with two parabolic mirrors arranged symmetrically so their coma cancels out. One possible U configuration is shown in the center diagram below.
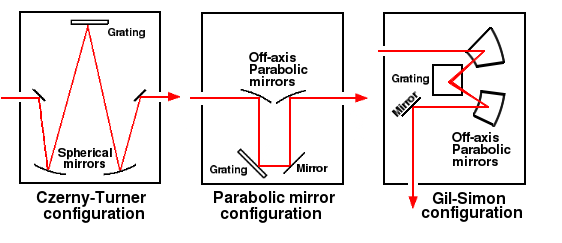 Czerny, parallel mirror, and Gil-Simon configuration. The first two are strictly
planar, while in the Gil-Simon configuration the mirrors are angled up and the
grating is raised above the plane of the spectrograph.
While this design works, there is a problem. Because the parabolic mirror presents an angled surface to the incoming light, the grating image suffers from Petzval field curvature. Field curvature is also present with spherical mirrors, but as the angle in an off-axis mirror approaches 90° the field curvature becomes increasingly severe, and rotating the grating causes part of the spectrum to strike the mirror at a different distance from the camera, making the path length different, and putting it out of focus.
A solution was found way back in 1983 by Gil and Simon [1], who proposed raising the grating above the plane of the spectrograph. The two off-axis mirrors are rotated so they both focus at the same point on the grating. This causes the spectrum to be parallel to the tangential surface of the mirror. Schieffer et al. [2] built a spectrograph using this principle. According to Schieffer, the spectrometer produces curvature-free, nearly perfect 1:1 images of the slit. They measured a resolution of 25,000 with a 1500 lines/mm grating. Well ... we gotta make one of these!
In this design, the elevation angle has to be the same as the mirrors' off-axis angle. In the case of 90° off-axis mirrors, this means the beams point straight up. This makes the spectrograph a little taller than usual, but more compact.
Focal length
In general, a longer focal length means a bigger image size and therefore less sensitivity. It also gives higher resolution, but requires larger optical components, making it heavier and more expensive. However, too short a focal length increases spherical distortions. The absolute minimum focal length is set by the camera. In the case of a Nikon DSLR, which is the camera we will be using, the F-mount specifies that the image sensor is 46.5 mm from the mount. Thus, 46.5 mm is the absolute minimum focal length we can use. To make things easier, we will use 100 mm focal lengths throughout.
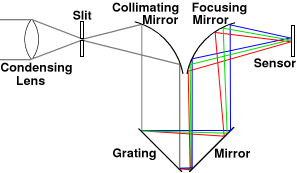 Optical path
It has been shown mathematically that best results are obtained when the grating is one focal length from the mirror. The collimating mirror must also be exactly one focal length away from the slit, which serves as the light source. This causes the collimating mirror to make the light rays perfectly parallel when they strike the grating. If the light is not collimated, you will get field curvature, which causes different parts of the beam to go out of focus as the grating is rotated. Any optics on the other side of the slit, such as a condensing lens or a telescope, have little or no effect on the image; their sole purpose is to concentrate as much light as possible on that slit.
In a spectrograph the f-number is the focal length divided by the diameter of the mirrors. In this case, we have a 101 mm focal length and 25.4 mm diameter mirrors, making it f/4. However, the full aperture is not used if the slit height is less than 25.4 mm, so the f-number will be higher. For a 10 mm slit, it becomes f/10.
Although the camera has to focus on the slit and not the grating (see below), the region between the two curved mirrors is unfocused and does not contribute to the focal length. Therefore, the sensor is positioned 1 focal length from the focusing mirror.
Plane mirrors
Plane mirrors are sometimes needed to make the deign practical. Plane mirrors are available with a variety of coatings and substrates. The two main types are metal mirrors (aluminum, silver, or gold) and dielectric mirrors. Dielectric mirrors have higher reflectivity, but too narrow a bandwidth for our purposes. For UV, aluminum mirrors with MgF2 coatings are preferred. The number of mirrors must be kept to a minimum to reduce the light loss. Reflections in a plane mirror do not change the focal length—they merely fold the path.
Only front-coated mirrors can be used. Rear-coated mirrors give double images, and economy mirrors on aluminum, plastic, or float glass are not flat enough (>5λ compared to λ/10) to be useful.
Dynamic range and wavelength range
The camera is used in Raw mode. For a Nikon D90, not considering camera read noise, this gives 12 bits (4096 counts) per pixel. Thus, the dynamic range is 4096×the height of the spectral line. If our spectra are 400 pixels high, we will have a dynamic range of 1.64 million counts. Part of the calibration process is converting these counts to photons.
A DSLR camera modified for infrared can measure wavelengths from about 310 to 1100 nanometers. An unmodified camera can measure from about 400 to 640 nm. This varies from camera to camera depending on its internal filters. Ideally, we would use a 16-bit cooled CCD monochrome camera, which would give us much greater sensitivity and higher dynamic range. For UV, special thinned CCDs and diode arrays are available which can detect down to 200 nm. While our camera can't go that far into the UV, we want to prepare for that eventuality.
Both the dynamic range and the resolution can be traded for sensitivity by software binning. I use the Linux program Imal for this. This software can also do densitometry, which we will need to convert the images to spectra. (Photoshop and its clones are not recommended for this. They're not designed for scientific use and can lead to very inaccurate results. I know one guy who had to re-analyze an entire experiment when he discovered this fact.)
Grating basics
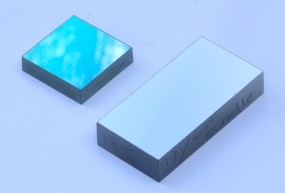 Holographic and echelle gratings
Gratings are basically mirrors that reflect different wavelengths at different angles. The theory of gratings is described in many places, so we won't cover it here. In practical terms, a grating produces several copies, called orders, of the spectrum, starting from 0 and increasing by integers. The spacing between lines increases with the order, but the intensity decreases. Zero order gives you an image of the slit, which is very convenient for focusing. Gratings are almost always used in the lowest (first) order because higher orders overlap with each other, which would require using filters to block unwanted lines.
Most spectrographs use reflecting gratings. Prisms and transmitting gratings have their uses, but are generally considered low-resolution elements because they have less ability to separate wavelengths, known as dispersion. The dispersion of a prism approaches that of a grating only at wavelengths close to where it begins to absorb light. For example, a big quartz prism can have the same angular dispersion as a 1200 l/mm grating at 200 nm, but its performance falls off very rapidly as wavelength increases [6]. The maximum resolution R of a 1-inch prism is 7500 at its wavelength limits, and about 1/10 that in the visible range. This compares with a theoretical R of >31,750 throughout the visible range for first-order spectra in a 1200 l/mm grating of the same size—42 times more. Since resolution of a prism or grating is proportional to its size, you could also say that a prism would have to be 42 times bigger than a 1200 l/mm grating to achieve the same resolution.
Because resolution is proportional to the projection of the grating width and the number of lines per millimeter, the light rays should illuminate as much of the grating as possible. This means that the diameter of the collimating lens has to be the same as the width of the grating in order to achieve maximal resolution. It also means that, for a given lines/mm, resolution is always linearly proportional to grating size. For example, a 300 mm wide astronomical grating would have 11.8 times higher resolution than a typical one-inch grating.
There are two main types of gratings: ruled and holographic. Ruled gratings give about twice the intensity of holographic gratings, but they also have more artifacts, which means more background noise, called ghosts and grass.
Most ruled gratings are blazed. Blazed gratings are not symmetrical; the intensity is different on each side. Blazed gratings are always marked with an arrow that shows the correct orientation. Blazing increases the intensity at a specific angle, typically strengthening the first-order spectrum.
A third type of grating, called an echelle, is basically a stack of gratings next to each other, and creates a very high resolution, two-dimensional pattern. This makes them a good match for a digital camera, but they are also bigger, more expensive, and harder to use than a regular grating. Echelles are used in orders of 100 or so and can have resolutions over 1,000,000. This is about the maximum resolution that is generally useful, because of temperature-dependent Doppler broadening of emission lines. Doppler effects also change the line shape from Lorentzian to Gaussian, so the way these spectra are analyzed is also different.
Another diffractive element that is sometimes used instead of a grating is a Fabry-Pérot interferometer. These are quite expensive, but give phenomenally high resolution over a narrow range.
Two other grating parameters are line spacing, which determines the resolution, and blaze wavelength, which determines the optimal wavelength. You don't always want the highest possible resolution, because a high resolution spectrograph is harder to calibrate and only shows a small portion of the spectrum at a time. A good instrument maximizes both the resolution and wavelength range. With a bad one, we would need to use a more powerful grating to get the same resolution, which would mean a narrow range and lower sensitivity.
Resolution
Resolution is purely a function of the grating. The purpose of all the other stuff is to screw up the resolution as little as possible. This means that everything must be perfectly aligned, the spectrum must be perfectly horizontal on the image sensor, and the spectrum lines should be as straight as possible. I found that aligning lenses and spherical mirrors is easy, but it can very challenging to align these off-center parabolic mirrors. If I ever built another one of these, I would use longer focal lengths and 2-inch components throughout.
Since resolution is proportional to the number of lines on the grating, the collimating mirror must illuminate as much of the width of the grating as possible. For example, a 2-inch-wide grating will have twice the resolution of a 1-inch grating. However, you would also need 2-inch-diameter mirrors in order to make use of the big grating. If you used a 1-inch mirror, it would only illuminate half the grating, giving you half as much resolution.
Calibration lamps
 Xenon low-pressure calibration lamp
A spectrograph is useless unless you can calibrate the wavelength. Some people use neon lamps, which have numerous lines between 585 and 1114 nm. However, they have very little emission in green, blue, and ultraviolet. A popular choice these days among pros is a pencil-style mercury-argon lamp, which has lines from 185 to 1711 nm. But you can expect to pay at least 200 bucks for the bulb, plus another 200 for the power supply. Spectral Products and Ocean Optics also sell one that runs off a nine-volt battery. Expect to pay about 500 bucks. Newport's is more, but comes with a battery. The lamp in this type is not replaceable.
A good low-priced solution is a low-pressure xenon or argon emission lamp like those sold by Edmund Optics. Xenon emits a series of lines across the spectrum. The lamps, known as spectrum tubes, are interchangeable, and a wide variety of tubes for mercury, argon, and hydrogen can be bought for as little as 20 bucks each. The trade-off is a shorter lifespan and the requirement for AC power. Another drawback is that unlike the pencil lamps, these lamps have to be used on a 30 seconds on, 30 seconds off cycle to prolong lamp life.
During construction, many people use a compact fluorescent bulb. They're cheap, and they have numerous sharp lines in the orange and two bright lines in the green that are easy to separate even in a low-resolution instrument. You can observe them easily by looking at a CF bulb reflected in a DVD using two fingers as a slit; see image below.
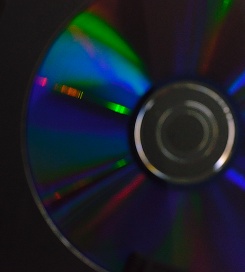 Spectrum of a compact fluorescent bulb using a DVD. The orange lines and the bright
green doublet are visible at two different angles. Two steel rulers were used as a slit. Notice that the DVD
is out of focus. The camera must be focused on the reflection of the slit, which
was 3 feet further away, and not on the DVD, for the spectrum to be in focus.
An online database of emission wavelengths is available at http://physics.nist.gov/PhysRefData/ASD/lines_form.html . In the visible between 400 and 700, Xe I has 352 lines (mostly weak), argon has 227 (also mostly weak), and Hg I has only 100. Iron has many more lines, and it's of great interest in astronomy. For example, one would expect meteors to emit strong iron lines. However, it's a lot of trouble to get an clean iron plasma calibration source. In the lab, hollow cathode tubes are used, but they're tuned to emit a single wavelength. Stellar spectra can contain very high ionization states, making the spectrum very complex. A degree in astrophysics would also come in handy.
Here is where another engineering trade-off comes in. If you make the grating rotation mechanism precise enough, you can get away without the need to superimpose calibration lines on every spectrum. Commercial spectrometers use this method, because their customers don't want to calibrate every time they run a spectrum. It's more work, but it will make your instrument better and more compact. Professional astronomers use fixed gratings, mainly because their gratings are so large.
The image below shows how it's done in a commercial fluorescence spectrometer. A stepper motor is connected by a timing belt to a leadscrew that drives a moving platform left and right. The platform rotates an arm, which is attached to a grating in the optical compartment. On the left, another belt goes to an odometer-type wavelength display, which is not visible in the picture.
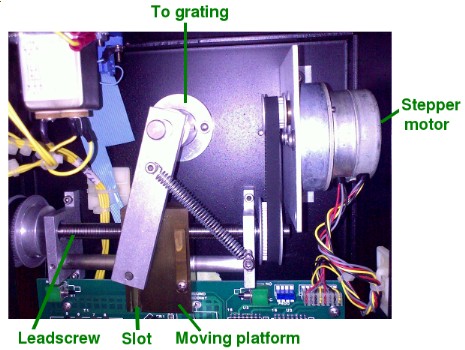 Grating rotation mechanism in a Spex 1681 monochromator
The important thing to notice is that the grating rotation is not linearly related to the wavelength. The mechanism makes the grating rotate faster when it is facing the light source. The speed approaches zero as its angle approaches 90°. These instruments usually use 3×3 inch gratings and 3-inch diameter concave mirrors in a Czerny-Turner configuration.
Click here to go to Part 2: Spectrograph Construction
References
[1]. Gil MA, Simon JM (1983). New plane grating monochromator with off-axis parabolical
mirrors. Appl. Opt. 22, 152-158.
[2]. Schieffer SL, Rimington NW, Nayyar VP, Schroeder WA, Longworth JW (2007). High-resolution,
flat-field, plane-grating, f/10 spectrograph with off-axis parabolic mirrors.
Appl. Opt. 46, 3095-3101.
[3]. Chupp VL, Grantz PC (1969). Coma canceling monochromator with no slit mismatch.
Appl. Opt. 8, 925-929.
[4]. Harrison KM. Astronomical Spectroscopy for Amateurs. Springer, 2011.
[5]. Nakamura J, ed. Image Sensors and Signal Processing for Digital Still Cameras.
CRC Press, 2006.
[6]. Thorne AP. Spectrophysics, 2e. Chapman and Hall, 2013, p 139.
