 ast year a reader emailed me about an infrared fluorescence imager he
had built. It looked like he had good results with it. I finally got around
to trying it myself.
The goal is to find out if the technique works as well as is claimed before buying an expensive instrument. I've seen some results from commercial instruments that looked great and others that were so bad I wouldn't allow my staff to use them. But the real reason is to play around with optical stuff!
Imager dark box
We'll be using the same dark box and optics that I used for the chemiluminescence imager (see here). The imager will create 16-bit grayscale images from chemiluminescent blots or fluorescent blots depending on what LEDs and filters we use. A white LED is used for focusing and for creating 48-bit color images (16 bits in three channels) from blots with colored molecular weight markers, which are used to calculate the molecular weight unambiguously on a blot.
Most large-aperture commercial lenses need refocusing at near-infrared, and users will have to manually refocus when they switch from chemiluminescence to infrared. Standard one-inch infrared filters are also much thicker than the SBIG filters, which can add enormously to the focusing problem. A 1/4 inch thick filter can be equivalent to moving the camera from 24 to 16 inches away, putting it inside its minimum focal distance.
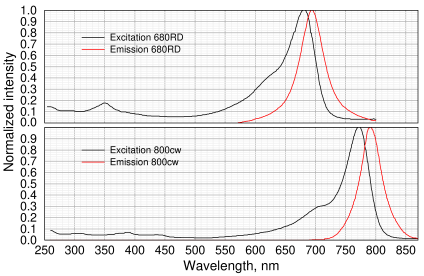
Li-Cor IRDye spectrum of 680rd and 800cw (redrawn from spectra in vendor's manual)
If you're building an imager for the first time, locate the camera so it can reach focus at 800 and 400 nm. Spray paint the inside of the dark box with matte black. Otherwise the excitation light will cause weird reflections in the image. This isn't necessary if you're only doing chemiluminescence.
It's also a good practice to use a modular design with the camera, emission filter, and focuser in one module and the light sources on the other. That's because you may decide to move the light source closer or farther away from the sample to improve the sensitivity or beam uniformity.
If you're a perfectionist, you could use multiple LEDs with different wavelengths arranged symmetrically around the lens, each with its own emission filter and a diffusion filter to make the beam perfectly uniform. An alternative to LEDs is to use an infrared laser; however, infrared lasers are very hazardous to work with because the beam is practically invisible. Special infrared-blocking safety glasses are essential, and they're very expensive.
Another disadvantage of lasers is that it's more expensive to produce a uniform illumination. Frosted glass diffusion filters don't work with laser light because they create speckle patterns, but they are just fine for LEDs.
Signal-to-noise ratio
Unlike chemiluminescence, where the only background noise is camera read noise, hot pixels, and the occasional pesky cosmic ray, in fluorescence there is a high background caused by light contamination from the light source and background fluorescence from the sample. This means the excitation and emission wavelengths need to be cleanly separated. You can see the problem by examining the spectrum above of a typical infrared fluorescent dye (in this case, Li-Cor IRDye 800CW bound to goat anti-rabbit (part no. 926-32211).
Light source
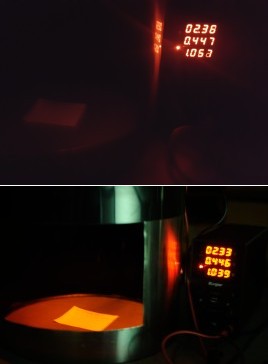
Imager with 700 nm light source. Upper = cell phone image, lower = image from near-infrared sensitive camera
In the graph, it can be seen that the excitation and emission λ actually overlap each other. This means that separating them by using filters at the peak λ (773 and 792 nm) is challenging. Even a laser source might not be good enough. Instead, we will use the 700–750 nm shoulder. One advantage of this is that LEDs in this range emit light as short as 640 nm, making the light pattern visible to the eye. A disadvantage of shorter λ is potentially higher fluorescence from the blotting membrane.
PCB-mounted LEDs are far superior to those little epoxy-encapsulated leaded LEDs many people are familiar with because the epoxy ones have a little plastic lens on the top that creates an uneven illumination pattern. I used a Thorlabs M730D3 MCPCB-mounted LED (730±10 nm; output power 125 mW, 1.0 μwatts / mm2). Soldering wires to these guys is a royal pain because they're on an aluminum substrate. They also need to be screwed down to a heat sink and thermal compound is essential. The holes are quite small and a 1-72 or smaller thread screw is needed.
We also have to decide whether to mount the light source near the top (near the camera) or on the sides. Mounting it on the top makes it easier to get a uniform illumination. The disadvantage is that the sample can't have any water or other shiny material on it. This would produce a specular reflection that would ruin the image. So we'll mount it on the sides, about six inches above the target. To get uniform illumination, we'll need two light sources, one on each side, on manual rotation stages. Even so, for professional use you'll need to do a flatfield correction no matter where you put the source.
At right are photographs of the imager taken with a cell phone and with an infrared-sensitive camera. The infrared-sensitive camera shows that the LED illuminates the entire sample platform. A constant-current power supply or an appropriately sized current-limiting resistor is necessary. The value of the resistor needed is R=(Vo−VLED)/i, where Vo is the power supply voltage, VLED is the maximum forward voltage of the LED, and i is the desired current in amperes obtained from the datasheet.
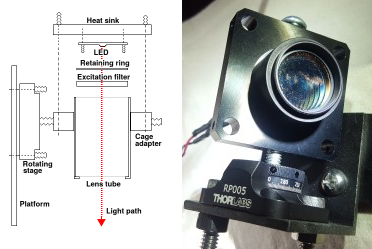
Light source mounted on a manual rotation stage. The LED and excitation filter are inside the 1-inch lens tube. The LED's heat sink and the stage are attached to the square cage adapter. The light source can be rotated to within one degree thanks to the markings on the stage. An end cap on the back of the lens tube is needed if you use a low-power LED without a heat sink.
Emission filter
If your filter wheel uses 38 mm filters (as SBIG does), you'll need to re-mount your emission filter in a 25 to 38 mm adapter. This is easy: drill a 1-inch hole in a 1/8-inch thick plastic disk. Cut the disk to a round shape a little over 38 mm. Use black epoxy to seal it in place and cover any light leaks. The disk should be metal, Delrin, or black Plexiglas. Colored Plexiglas is transparent to near-infrared and would leak unfiltered light.
You'll need a total of five filters: red, green, and blue to create color images, a quartz or UV-IR block filter for chemiluminescence, and a 790 or 800 nm filter for infrared. Don't scrimp on the filters. An OD 2 filter blocks less of the unwanted light, so it won't give as good a result as an OD4 filter. Even with an LED 60 nm from the emission peak, sharp cutoff filters are necessary to make this thing work.
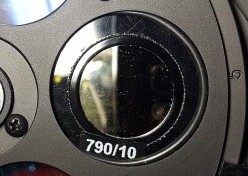
790/10 nm emission filter in adapter
Camera
CCD cameras have a linear response to intensity, but CMOS cameras don't. If you use a CMOS camera, the output must be calibrated or your results will be meaningless. The camera must also have a 16 bit ADC and it must be sensitive to near-infrared light. Most astronomy cameras can measure near-IR; unfortunately, many vendors are now cutting corners, selling ‘astronomy’ cameras with only 14 or even 12 bits of pixel depth. They might produce a 16-bit file, but the results will not be adequate for scientific use. Be warned: Using a CMOS camera or a 12-bit camera on a Western blot would produce unacceptable results. If the camera is advertised as ‘color’ it almost certainly does not have the necessary pixel depth or wavelength sensitivity. There's a whole science dedicated to determining whether the camera really does what the vendor claims.
Test images
Below is a test image I obtained from this setup, unretouched. Different amounts of fluorescent antibody were spotted on a piece of low-fluorescence PVDF. One microliter of the antibody diluted 1:10,000 in a spot about 2 mm in diameter was detectable with a 12 second exposure. The limiting factor is the background fluorescence, which is so bright the writing on the blot (done with carbon paper to avoid smearing) was plainly readable. Although the background was uniform enough to be subtracted to increase sensitivity, doing so can make the image appear grainy.
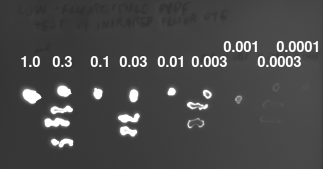
Infrared test image with 730 nm LED. Samples: 1 to 0.0001 microliter of IRDye 800CW 1μg/μL spotted on low-fluorescence PVDF. Filters: Ex=775 nm OD 4 shortpass, Em=800 nm 10 nm bandpass. Exposure: 12s, 2×2 binning. Original image size 1676×1266. Cropped and resized to 1/4 of total area and converted from 16 bit grayscale to 24-bit RGB color. All samples above 0.001 μL are saturated (pixel value = 65535). Limit of detection was 1×10⁻¹⁰g. Considerable background fluorescence is still present
Artifacts
When doing dot blots on PVDF, the buffer combined with the suction from the apparatus can add small amounts of fluorescence to each well. This gives a false impression of high sensitivity. We can check this by remembering that fluorescence imaging is the most linear method available. Do a serial dilution on a dot blot and test the result by doing densitometry on the bands. Then check the linearity. If your test image shows more dynamic range than your camera is capable of, it means the high sensitivity is not real.
SDS
Better S/N is obtained if the blot is completely dry before imaging. The dye vendor says that soaking the blot in 0.01% SDS will reduce the background fluorescence. This had no effect on my blot.
Improvements
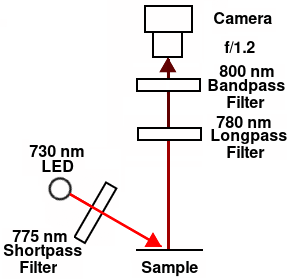
Final configuration
The signal can be increased by focusing the beam. Both plastic and glass lenses work fine for infrared. The lens needs to be good quality to avoid getting uneven illumination. I had good success with a Thorlabs LE1985A 50.8 mm diameter fl 300 mm N-BK7 A-coated (+) meniscus lens that I had lying around, and of course you'll also need a lens mount.
However, the biggest challenge in fluorescence is not signal intensity but background level. Low-fluorescence PVDF is recommended even for infrared to reduce the background. Higher signal is still desirable, as users will complain if it takes more than a few seconds to acquire an image.
The best results were obtained using a high-power 730 nm LED with a 775 nm shortpass excitation filter along with a 780 nm longpass emission filter and an 800 nm bandpass filter as shown in the diagram at right. I needed two emission filters to suppress the excitation light sufficiently to obtain a usable background. The signal/background ratio was 2.6 for 2.5 μg protein and 5.9 for 20 μg protein. Any indentations in the membrane caused by writing on the blot or produced by dot-blotting produced a small artifactual fluorescence. The Novex MW markers also showed fluorescence.
With this configuration it took over 60 seconds to obtain a usable image (below). Switching from an 800 nm to an Edmund 790 nm OD4 filter shortened the time, but the filter was so thick the camera had to be raised an additional four inches to allow the lens to reach focus. It also gave more light contamination. The ideal emission filter would be a 790 nm OD4 longpass filter, but I could not find any vendors that had those in stock. Stacking up multiple filters helps a bit but forces you to make longer exposures.
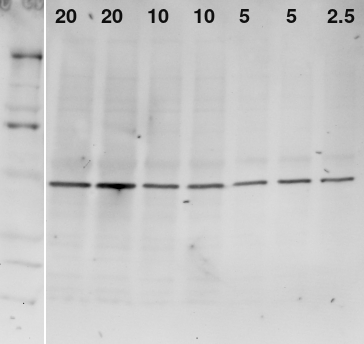
Infrared Western blot of actin in brain homogenate. Sample: brain homogenate, 2.5 to 20 μg total protein. Excitation: 730 nm + 775 nm shortpass. Emission: 780±7 nm longpass + 800 ± 10 nm. Exposure: 60s, f/1.2, 2x2 binning. Antibody: Invitrogen MA5-15739, 1:3750, 800CW Goat anti-mouse 1:800. Image was inverted, contrast-enhanced, and labeled
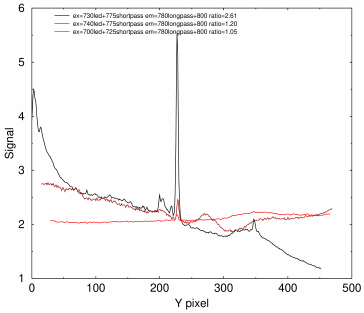
Densitometry tracing of actin band from 2.5 μg total protein using 700 nm LED (red), 740 nm LED (dark red), and 730 nm LED (black). Top of blot is at left
Results
We can tell a number of things from the Western blot shown at right.
The staining was reasonably linear with the amount of sample considering my pipetting error. No extra bands or smudges caused by the stain are visible. The signal to noise ratio for a 20 μg band was 16000/326.9 or 48.9. The signal to background ratio for the 2.5 μg band was 9600 / 2309 or 4.15.
Even with low-fluorescence PVDF, background fluorescence is still the limiting factor. If background fluorescence could be reduced even more, the sensitivity would be comparable to some of the less sensitive chemi reagents.
The blot had to be perfectly dry before an acceptable image could be taken.
Because of the high background, IR fluorescence isn't as sensitive as chemiluminescence. If I had used Thermo's SuperSignal Atto Western Blot HRP substrate with these samples, the chemiluminescent signal would have saturated the camera in a five second exposure.
Unlike chemiluminescence, the fluorescence remains stable for a long time. This is a tremendous advantage because you can save the blots indefinitely and re-image them if needed. Fluorescence also needs fewer washing steps. In fact, washing with TBST just makes the signal weaker without affecting the background. Washing in 0.02% SDS also had no effect. Could the membrane be picking up high background from the blotting steps or from BSA or Tween? No, the fluorescence from new and blotted membranes was actually the same.
The matte black paint looked perfectly black to the eye, but an infrared camera showed that it was not dark at all in the infrared. This increased the background in the image. Black flocked paper was even worse, appearing blazingly white in infrared. So the next improvement was to find some near IR-absorbing paint to make the dark box stealthier. Metal velvet and Light-absorbent foil from Acktar are probably ideal but are expensive. Black anodized flashing from Home Depot was better but still too glossy. We used black aluminum foil (Thorlabs) with good results.
Cost comparison
Chemiluminescence using Thermo's SuperSignal West Atto requires 1 ml of reagent for a 10×10 cm blot at a cost per gel of $4.68. Only a tiny amount of HRP secondary antibody is needed, so the cost of the secondary was almost insignificant (7.5 cents/blot) for a total cost of $4.75 per blot.
For infrared fluorescence, we found that it was necessary to use 1:800 dilution of the secondary antibody to get a good signal. Using 10 ml buffer in the secondary antibody step, this means 12.5 μl of secondary for a cost/gel of $4.88. Low-fluorescence PVDF costs almost the same as ordinary PVDF. The end result is that the two techniques cost about the same. However, I found one paper that claimed to use a 1:10,000 dilution. If this works, it means IR would be 12 times cheaper than chemiluminescence.
Fluorescence is easier to use and is permanent, while chemiluminescence has higher sensitivity but must be imaged within a few minutes after the substrate is added. Another disadvantage of chemi is the risk of depleting the substrate. The symptom of this is that strong bands become “hollow”, which means the center of the band shows weak signal because the reagent was used up. Fluorescence doesn't do this; it merely saturates.
Alternative light sources
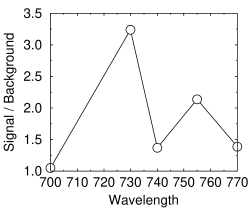
Signal / background of the weakest actin band vs LED peak wavelength
The signal/background ratio is the most important parameter because you can compensate for a low signal by adding more LEDs.
I measured the signal/background ratio for the faintest band on the blot shown above using different wavelength LEDs. The graph at right shows that the best results were obtained at 730 nm. However, there is a complication that some LEDs are very sensitive to voltage. For instance, the Stanley FWR1107MS-TR 755 nm LED gave a good result at 1.6 volts, but its output and bandwidth both increased dramatically as the voltage increased. This caused the background to increase, making it unusable above 1.65 volts (see graph), well below the maximum of 1.9 stated on the datasheet.
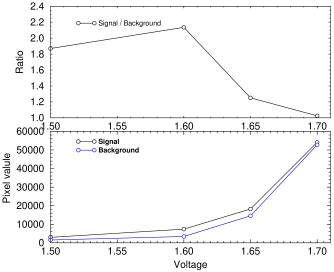
Signal and background vs LED voltage for FWR1107MS-TR 755 nm infrared LED
All the bands in the actin blot were visible with a 700 nm LED provided that I put a 725 or 775 nm shortpass filter in front of it. However, the signal to background ratio in each case was only 1.05.
To see what would happen if I used 780 nm as an excitation wavelength, I put a Thorlabs LED780E Ultrabright near-infrared LED (780±10 nm, 18 mW) in a 1-inch stackable lens tube along with a 780 nm filter and pointed it at the sample. The beam was not visible to the eye, but the infrared camera showed a reasonably uniform coverage. With an 800±10 nm emission filter, the signal from 770 and 780 nm LEDs was completely washed out by background due to the overlap of the excitation and emission curves.
LEDs tested
-
700 nm near-infrared LED: Thorlabs M700D2.
-
730 nm near-infrared LED: Thorlabs M730D3, 730±10 nm.
Needs 2.7 volts 500 mA. Emits some energy from 640 to at least 780.
Output power is 125 mW. Used with 775 nm shortpass filter.
- 740 nm near-infrared LED: QT-Brightek QBHP684-IR4XU (Digikey). Despite its small size, this one-watt SMD LED was easy to solder to a copper heatsink and emitted a lot of light. Even with a big heatsink, the temperature rose to 110°F in a few minutes when powered at 2.0V and 314 mA.
- 755 nm near-infrared LED: Stanley FWR1107MS-TR (Digikey 404-FWR1107MS-TRCT-ND). It's tricky to solder to this one because you can barely see it without a microscope. Bandwidth is strongly dependent on voltage. SMD design.
- 770 nm near-infrared LED: Marktech MTE1077N1-R (Mouser). Has an epoxy lens on top. A diffuser is needed.
-
780 nm near-infrared LED, Thorlabs LED780E.
Not very powerful, only 18 mW of light. Needs a rotating mount and should
be within six inches of the sample. At least two are needed to get
a uniform illumination pattern.
- White visible LED: Cree XL7090. Produces way too much light for the CCD camera. Use it at the lowest voltage that will produce light: 2.63 V 0.016 A or use a neutral-density filter.
Filters used
- 775 nm Edmund 86104 OD4 shortpass 775 nm 25 mm diam.
- 780 nm Newport CGA-780 780±7 nm longpass 50×50 mm filter.
- 790 nm Edmund 67846 Filter int 790 nm 10 nm FWHM 25 mm diam.
- 800 nm Thorlabs 1 inch bandpass filter 800 nm FWHM 25 mm diam.
Hardware used
- SM1L10 Thorlabs 1 inch stackable lens tube. SM1 is the term for 1.035"-40 thread that accepts 1 inch 25.4 mm diameter optics. The tube has an internal thread on one side and an external thread on the other.
- Thorlabs SM1CP2M SM1 series end cap.
- Threaded retaining ring if not included in the tube lens mount.
- Thorlabs RP005 1 inch manual rotation stage. Has 1/4-20 threads. Ordinary round head screws won't fit. It needs a socket head screw.
- Edmund 11213 ME tube cage adapter, 50.8 mm sq. This has 1/4-20 threads that can connect to the Thorlabs rotation stage.
- Aluminum angle 1/8 inch thick, 2 inch wide.
- Aluminum plate 3/8 inch thick, 2× 3 inches for heat sink; 2× 2 inches instead of cage adapter.
- Itech IT6721 constant current DC power supply. Avoid cheaper ones like Kungber SPS305, which can't set the current or voltage limits beforehand. This can result in spikes that will fry the LED.
- Matte black spray paint or black aluminum flashing.
- 24-gauge red and black wire.
- Banana jacks.
- 1/4" black Delrin.
- Screws: 1/4-20, 6-32, and 1-72.
- Camera Sbig STF-8300M with Nikon lens adapter and 5-position filter wheel.
- Nebulosity software.
- Epoxy cement
dec 13 2022, 4:31 am. last updated sep 30 2024
 Modifying a Nikon D90 DSLR for Infrared Photography and Astrophotography
