Photographing Fluorescently Stained 2D Gels
 luorescent gel stains have many advantages over colorimetric stains.
They are easier to use and can yield quantitative results that are
linear over 3 to 4 orders of magnitude. However, it is necessary
to pay more attention to the technicalities of image acquisition to
obtain usable data. Fluorescent stains also require special equipment.
This article discusses some of the common fluorescent dyes and
describes how to build a light source for photographing fluorescent
2D gels using a CCD camera.
Coomassie Blue and Silver
Coomassie Brilliant Blue R250 and G250 have been used to stain gels for many years. Even so, many labs underestimate the sensitivity of Coomassie blue because their staining protocol is not optimal. One paper describing a new "ultrasensitive" modification of Coomassie turned out in our hands to be about ten times less sensitive than our current technique. The detection limit of Coomassie is much lower than the 1 microgram per band that is commonly quoted. When properly stained and destained (a process that takes at least 18 hr), Coomassie blue can easily detect 100 ng of protein. Nonetheless, as Fig. 1 shows, fewer spots are usually visible on a Coomassie stained gel than with other stains.
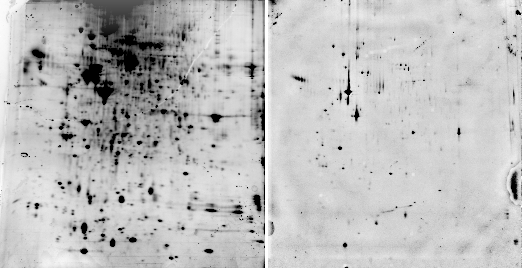
Fig. 1 Sypro ruby stained gel (left) vs. Coomassie stained gel.
When complexed to protein, Coomassie blue fluoresces in the infrared [1]. In a fluorescence spectrometer, Coomassie fluoresces at around 662 nm. This is near the limit of the eye's sensitivity, but well within the range of CCD cameras. Luo et al. used 550 nm as an excitation wavelength, which is near the absorption maximum of 595 for Coomassie blue R250. The authors published a distinct band from 10 ng of protein obtained using Coomassie blue R250 in a Li-Cor infrared scanner, which would make Coomassie almost as sensitive as Sypro ruby. However, Coomassie fluorescence is sometimes difficult to detect and it has not been widely applied. We have not yet succeeded in seeing Coomassie fluorescence in a gel using our CCD camera.
By far the most sensitive stain is silver stain. It is about 2-3 times more sensitive than Sypro Ruby and about 20 times more sensitive than Coomassie. However, silver stain has a major drawback: it is almost impossible to use for quantitation. Some spots stain light on a dark background, and others stain dark on a light background. The intensity of staining is difficult to control, and the background is often quite different on different parts of the same gel. There are also many "quick" silver stains sold to the unwary. People may not realize that by using a rapid silver stain, they may be losing a factor of 2-4 or more in sensitivity, thus putting their silver on a par with Sypro ruby or even Coomassie.
Although silver is not fluorescent, the discovery of photoactivated fluorescence of silver nanoclusters complexed with fluorophores such as thioflavin T [2,3] may lead to new ultrasensitive methods for silver staining gels in the near future.
FITC
Fluorescein isothiocyanate is a good stain for 2D gels, but it must be protected from light to avoid photobleaching. Texas Red isothiocyanate is another useful fluorophore, but its expense limits it to 1 mg/sample, with correspondingly lower labeling and sensitivity. FITC is advantageous because it is cheap. Two-dimensional gels can be stained with FITC after the IEF step by adding 5 mg of FITC in DMF. Incubate the focused IEF strip with FITC for 5 min, then incubate with 1M Tris-HCl (pH 8) for 5 min to remove unreacted FITC, which would otherwise cause smearing. Then incubate the IEF strip with SDS equilibration solution as usual. The advantage of FITC is that the gel does not have to be removed from the glass plates before photography. Conventional blue LEDs work well for fluorescein (ex=494, em=515).
One problem is it is difficult to print the images because printers don't have a wide enough dynamic range. When testing different methods we use IMAL, which has a local contrast enhancement filter that makes the faintest bands as dark as the most intense ones. After local contrast filtering, the only visible difference between faint and intense spots is that the noise is greater around the faint spots. Local contrast enhancement would therefore not be used for quantitation, but it is useful for identifying the coordinates of all spots on the gel.
Sypro Ruby
Sypro ruby is probably the most widely used fluorescent stain for 2D gels. According to the manufacturer (Invitrogen), Sypro ruby fluoresces with an excitation of 462 nm and an emission wavelength of 610 nm. In our spectrometer, a sample of BSA mixed with Sypro ruby had a maximum excitation at 469 nm and a maximum emission at 605 nm (Fig. 2). Red transparent Plexiglas (#2423), which cuts off below 600 (Fig. 3A), therefore makes a good, although not perfect, filter for Sypro ruby.
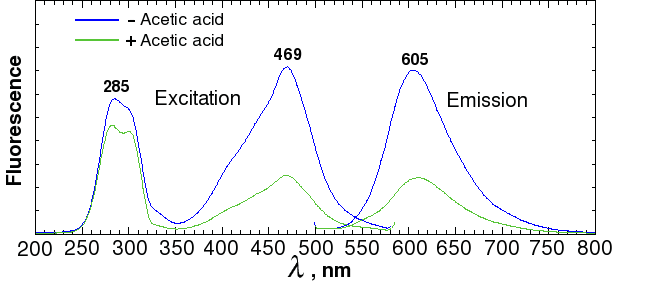
Fig. 2. Sypro ruby fluorescence spectrum
Binding of Sypro ruby to proteins occurs very slowly. A minimum of 18 hours is required to achieve complete staining. We have found that staining over a weekend gives an even stronger signal.
We also found that the fluorescence of Sypro ruby complexed with BSA in a test tube is markedly decreased by 10% methanol / 7% acetic acid (Fig. 2). Therefore, gels need to be washed with water before photographing if they have been destained with methanol/acetic acid. Some people have reported that methanol acts by stripping away SDS which is necessary for fluorescence. The graph above shows that the effect is actually caused not by removing SDS, but by direct quenching.
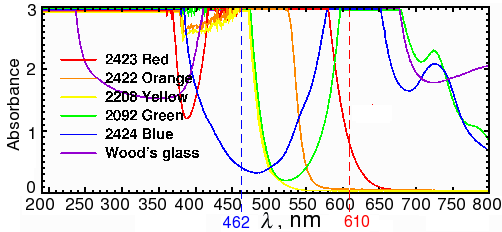
Fig. 3a. Spectra of colored transparent Plexiglas
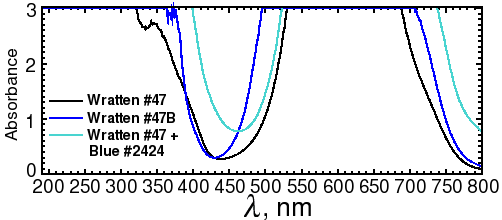
Fig. 3b. Spectra of Wratten #47 and 47B filters
Blue LEDs are a convenient light source for excitation of Sypro ruby. However, you can't just use any old blue LED. The blue LEDs in different gel documentation systems may look similar, but some (especially older models) have wavelengths as high as 490 nm, which gives a ten-fold fainter signal. Even an LED that is 10 nm off the peak will give a significantly weaker fluorescence.
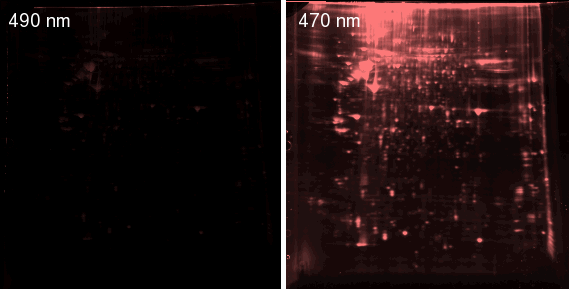
Fig. 4. Sypro-stained 2D gel photographed with CCD camera in conventional dark box with blue LEDs (left) and with low-power 470 nm LEDs (right). The exposure in both images was 1 minute.
The differences between different light sources are often obscured by the image acquisition software, which usually adjusts the contrast to give a good display. It's important to pay attention to the actual pixel values rather than the image that is shown on the screen.
It is also critical to expose the gel long enough to just fill the dynamic range of the CCD camera if you are doing quantitation. A camera with a resolution of at least 14 bits per pixel is essential for quantitation of fluorescent gels. For example, when the image in the left of Fig. 4 was taken, the display on the screen looked identical to that on the right. However, a histogram showed that the maximum pixel value on the left image was only 21760, while several of the spots on the image at right were saturated at 65535. A 15-second exposure was required to keep the brightest spots within the dynamic range of the CCD. For a 15-sec exposure, the highest pixel value was 51968, meaning the signal/noise ratio was 9.55 times higher with the custom-made LED light source than with the light source built into the gel documentation system. At least two different exposures (e.g., 15 sec and 1 min) should be made for each gel to allow accurate quantitation of both faint and intense spots. As shown in Fig. 5, many new spots become visible at longer exposures. A good light source and filter are therefore essential, because excessively long exposures (>10 min) will drown your protein spots in pixel noise, even with a cooled CCD.
A specialized gel scanner, such as a Typhoon, can provide sharper and flatter images than a CCD camera. However, they are quite expensive (around $100,000). The exposure times in a scanner are also much longer. A typical scan requires 6-10 minutes, versus 5-10 seconds in a CCD camera. Moreover, recently-manufactured Typhoons have a problem: they do not handle strong signals well. Spots above a certain intensity will give random pixel values instead of saturating. Imagine taking pictures with a digital camera, and finding that whenever a bright object, like the sun, was in the picture, it turns black. That's similar to what happens in a Typhoon. (I discussed this issue with the manufacturer, GE Healthcare. They professed to have never noticed this before.) ( Update: GE has now reproduced the problem.)
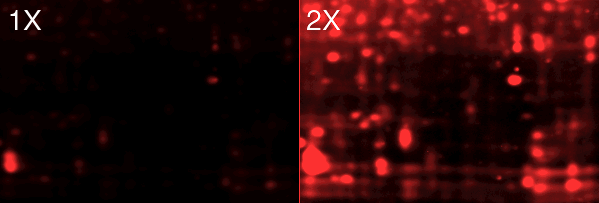
Fig. 5. Increasing contrast reveals additional fainter spots. These images were taken using a custom-made LED source (see below).
Construction of an LED light source for gel documentation system
Because our $40,000 gel documentation system didn't have an appropriate light source, we made one using LEDs and a plastic slide-in tray that doubles as a filter.
One of the main problems with LEDs is stray light. Although the amount
of stray light from LEDs is orders of magnitude less than the amount from
incandescent sources, all LEDs emit small amounts of stray out-of-band
light that gets through the emission filter. Unless this light is filtered
out, it will cause reflections from the gel, which appear as perfectly
round spots in the image. This was a problem with our commercially-obtained
gel documentation system. To avoid reflections, the light source has to be
at least x = wh/2f cm from the edge of the gel, where h is the
height of the light source, f is the focal length, and w is the width
of the gel (see Fig. 6a below). Placing the light source closer to the
gel allows the distance x to be made smaller, which is usually a practical
necessity because of limited space. Placing the source closer to the gel
also greatly increases the brightness, at the cost of some loss of spatial
uniformity of illumination.
In such cases, it's even more important than usual to apply a flat frame correction to the image before analyzing it. A flat frame is an image of a sheet of uniform fluorescent plastic. A response factor is calculated for each pixel to make the signal constant for a given amount of fluorescence. If your camera doesn't automatically apply a flat frame correction, it should be performed manually. Some image analysis software packages, such as Imal, have this facility.
If the method in the left of Fig. 6 is used, the LEDs can be mounted on a miniature rail and guide block system, such as a McMaster-Carr 9829K1 or Pacific Bearing Mini-Rail. After the apparatus is inserted into the tray rack of the dark box, the LEDs can be extended outward to the edge of the cabinet. The LEDs may also need to be adjusted vertically to prevent the light from being blocked by the rack.
Alternatively, the out-of-band light can be removed by adding a blue excitation filter. This allows the light source to be mounted in a fixed position closer to the center axis, as shown on the diagram on the right. Since the source has to be farther away from the gel to avoid blocking the image, more LEDs are needed to provide the same amount of illumination. Depending on the LED that you use, reflections may still be visible with long exposures. Unfortunately, the brighter the LED, the more out-of-band light it emits. A more effective (and expensive) filter, such as a Wratten No. 47 (410-500 nm), or 47B (400-470 nm) blue filter (Fig. 3b), or an interference filter such as those sold by Edmund Optics, OptoSigma, or Omega Optical, helps a little. However, with 1-watt blue LEDs, we were never able to eliminate enough of the out-of-band red light to block the reflections; even the combination of half an inch of #2424 blue acrylic and Wratten filters was not enough.
A better solution is to take one exposure with the lights illuminating one side, a second exposure with the lights illuminating the other side, and then crop and combine the two image halves by computer. This works because physics guarantees that the reflection is always on the same side as the light. In fact, it works so well that it's much faster to take two half-field exposures with no excitation filter than a single full-field exposure with a filter. For example, a Wratten #47 filter will block 61% of the light at its maximum transmittance wavelength, and almost 3/4 of the light at the Sypro peak of 469 nm. The figures for Wratten #47B are 67% and 95%. Thus, if you used a filter, you would have to expose as much as 20 times as long as with no filter.
An improvement to this technique is to use electronic switch to alternate rapidly between the left and right LED panel. Combined with two electronic half-shutters, this would eliminate the reflections without the necessity of combining two half-images.
As a test of the principle, we first constructed an LED light source using ten RL5-B08-360 ultrabright low-power GaN/InGaN 462-465 nm LEDs from superbrightleds.com , and wired them in parallel so they could be driven from two AA batteries, using the mini-rail design (Fig. 6, left). For filters, we used a 12×12 inch sheet of transparent red Plexiglass (#2423) ( www.estreetplastics.com, Part no. T012050100). I don't recommend wiring LEDs in parallel except for testing. I also don't recommend using batteries, because the ultrabright LEDs drain the batteries very quickly, leading to differences in exposure times. However, this light source is cheap to build, and it gave an order of magnitude stronger signal than the blue LEDs in the commercial dark box (Fig. 4).
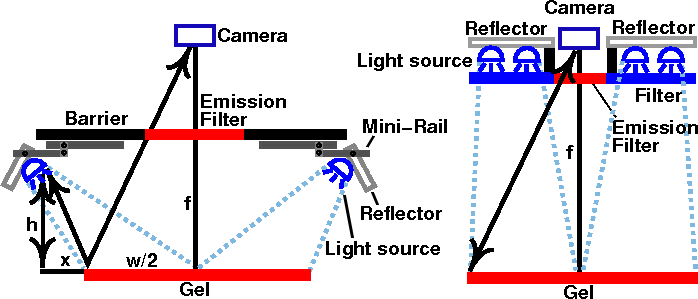
Fig. 6. Two possible arrangements for LED light source, with and without excitation filters.
Once we were sure the setup worked, we made a tray like that shown on the left of Fig. 6 using six one-watt Cree GaN/InGaN SMD LEDs (part no. XR7090RB). To power these LEDs, which cost ten bucks apiece, we used a 24 volt power supply (Mouser 418-TR36A24) and a 10Ω 20-watt power resistor (588-TAH20P-10-E). We mounted the LEDs on a large piece of 1/8 inch thick aluminum using three 4-40 screws, and added some Arctic Silver to ensure good thermal contact. These LEDs are rated for a maximum of 350 mA and produce 250 milliwatts of light. This is equivalent to 12.9 lumens at 465 nm. They are extremely bright. If you look directly at them, you will be seeing spots for hours. These particular LEDs need to be kept in their original package until soldering, because they will be damaged by soldering if they've been exposed to humid air. Using high-power blue LEDs cut our exposure time from 15 minutes to five seconds.

Fig. 7. LED circuit. LEDs are usually wired in series to ensure that the same current flows through each LED. The power supply must produce more voltage than the sum of the voltage drops from all the LEDs. The voltage drop is obtained from the datasheet supplied with the LED. For these high-power LEDs, a 10-Ω resistor is needed. Other LEDs will need a different one.
For a given LED, there is a tradeoff between LED life and brightness.
The current limits in the datasheet should never be exceeded. If the
current is exceeded, the LED will gradually become dimmer and eventually
will stop producing light. LEDs should be wired in series, not in
parallel, for greater stability, unless you give each LED its own
voltage dropping resistor (see Fig. 7). The disadvantage of
putting them in series is that you need a power supply that
produces a voltage higher than n × VLED, where
n is the number of LEDs and VLED is the specified
voltage drop across each LED. The value of the resistor needed
is R=(Vbatt-nVLED)/i,
where i is the current in amperes. The current is specified in the
datasheet for the LED as "continuous forward current."
For reproducibility, a precision power supply capable of regulating
its output within ±1-2% is recommended instead of a battery.
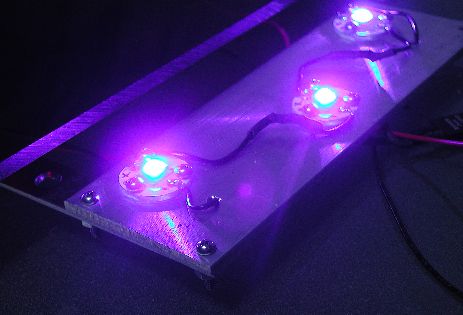
Fig. 8. Close-up of high-power blue LEDs.
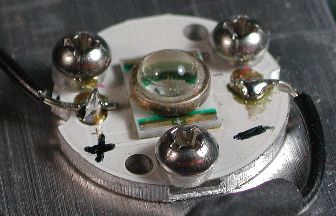
Fig. 9. Close-up of LED showing plastic spacer, made from a pipet tip, under screw head. The spacer is needed to prevent the screws from damaging the LED. It is difficult to solder the LEDs because of the integrated aluminum heat sink. (Hence the mess.) These LEDs should be mounted on a large aluminum heat sink; otherwise they will get hot, which will greatly shorten their lifetime.
Uniformity of illumination
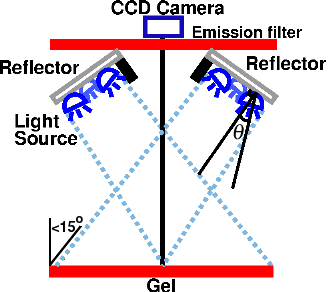
Fig. 10.
When making quantitative measurements, it's important to make the illumination as uniform as possible. Otherwise, your flat frame correction will add noise to the dark areas of your image and push the bright areas of your image into saturation. Depending on the LED, the gel may receive only 1/4 as much light flux at an angle of 45° as directly under your source. This would reduce your dynamic range by two bits. That's a lot; and it's fatal if you only have eight bits to start with.
Obviously, the further the LEDs can be placed from the image plane, the more uniform the illumination will be. Unfortunately, placing the LEDs an infinite distance from the gel is often not practical. Therefore, we need a way to calculate the minimum distance needed for an array of LEDs to provide uniform illumination. It turns out that there is already a theory, published in two papers by Moreno et al.[5,6], that describes how to do this.
For an isotropic emitter illuminating a flat plane, the light flux landing on the plane varies with cos3θ, where θ is the angle between the normal to the plane and the line from the source to the target [4]. However, LEDs are not isotropic sources, but Lambertian. This means the irradiance distribution is a cosine function of the angle. The cos3 term must therefore be multiplied by some power of the cosine of θ, so the actual incoming flux varies with cos4θ or higher. The exponent m of this power function is not necessarily an integer, but could be any number greater than 1. So the first step is to calculate m.
For a Lambertian emitter, such as an LED, the irradiance E depends on some power m of the cosine of the angle (θ) between the direction the LED is pointing and the direction to the target surface:

It is easy to calculate the exponent m from the graph of angle versus intensity in the manufacturer's datasheet:

where θ½ is the angle at which the intensity is reduced by half. For the Cree LEDs used here, the value for m is 1.57. Moreno et al. [5] derived a number of useful formulas for optimum LED spacing in a variety of arrangements of LEDs. Unfortunately, in practical situations when m is small, these equations make the light source bigger than the target and therefore impractical. An alternative approach [6] is to keep the LEDs close together and tilt them outward at an angle θ from the vertical to approximate a spherical source, as shown in Fig. 10. This prevents the beams from overlapping and producing a bright area in the center. For a circular ring of three or more LEDs, the optimum angle for producing uniform illumination is
 .
.
If the distance to the target is more than 5-10 times the distance between LEDs, this angle is independent of the distance to the target. It is also independent of the number of LEDs [6]. In practice, however, because of imperfections in most LEDs, installing them at an angle often makes the illumination pattern worse unless you have a large number (say, 10 or 20) of them.
To avoid reflections, we used cross-lighting, as discussed above and shown in Fig. 10. This means that the target is now tilted with respect to the plane of the light source. This will add a certain amount of non-uniformity. However, as long as the light source is sufficiently far from the gel that the angle of the target is less than 15°, the variation in intensity will be less than 4%. We used an SPDT switch to illuminate half the gel at a time (Fig. 11), and used Imal's "Paste right half" feature to combine the images. Although this arrangement requires two exposures, the total acquisition time is still under ten seconds because there is no need for an excitation filter. In addition to being more convenient, a shorter exposure time means less CCD noise.

Fig. 11. LED circuit.
Native Fluorescence
Proteins can be detected in the test tube with extremely high sensitivity using their native fluorescence. This suggests the interesting possibility of using 280 nm ultraviolet LEDs to obtain images of 2D gels without staining, as has been done with UV lasers [7]. UV LEDs are now available for wavelengths as short as 250 nm. A good source for UV LEDs is Sensor Electronic Technology, Inc. . They are still a bit expensive. Depending on wavelength, you can expect to pay up to $300 apiece for one of these babies. If anyone out there gets this working, I'd be interested in hearing about it.
Pro Q Diamond
Pro Q Diamond fluoresces in the presence of phosphoproteins (ex=550, em=580). In contrast to Sypro Ruby, whose fluorescence is quenched by washing with methanol/acetic acid, fluorescence of ProQ Diamond is greater if the SDS is removed by fixation in methanol/acetic acid. The methanol also must be removed before imaging. Selecting optimal filters is critical for seeing anything with ProQ Diamond. Most commercial scanners use a 532 nm laser and a 560 nm longpass or 570 nm bandpass filter. None of the Plexiglas filters shown above are appropriate for ProQ. ProQ Diamond does not have a strong UV excitation band and using UV is not recommended.
Side-Illumination
Some manufacturers now use a clever new trick to illuminate the gel: side-illumination. This uses a special type of acrylic plastic, known as Elit II or Endlighten, which contains microscopic particles that scatter the light evenly. LEDs are mounted on two opposite sides of the acrylic, and the gel is placed on top. The particles scatter the light up, producing a reflection-free fluorescent image. However, the excitation intensity is about 20% less in the center than at the sides, so the image must be corrected using a flat-frame (what one vendor calls a "neutral frame") correction. One problem is that currently you can only buy it in 10 by 6.5 feet pieces.
References
[1] Quantitation of protein on gels and blots by infrared fluorescence
of Coomassie blue and Fast Green. Shen Luo, Nancy B. Wehr and Rodney L. Levine.
Anal. Biochem. 350(2), 15 March 2006, 233-238.
[2] Photoactivated Fluorescence from Individual Silver Nanoclusters.
Lynn A. Peyser, Amy E. Vinson, Andrew P. Bartko, Robert M. Dickson.
Science 5 January 2001: 291(5501), 103-106.
[3] Water-Soluble Hybrid Nanoclusters with Extra Bright and Photostable
Emissions: A New Tool for Biological Imaging.
Natallia Makarava, Alexander Parfenov and Ilia V. Baskakov.
Biophys. J. 89:572-580 (2005).
[4] P.C.D. Hobbs, Building Electro-Optical Systems: Making It All Work.
Wiley-Interscience 2000, p. 322.
[5] Moreno I, Avendano-Alejo M, and Tzonchev RI (2006) Designing light-emitting
diode arrays for uniform near-field irradiance. Appl. Optics 45(10), 2265.
[6] Moreno I, Munoz J, Ivanov R, (2007) Uniform illumination of distant
targets using a spherical light-emitting diode array. Opt. Eng. 46(3), 033001
[7] Roegener J, Lutter P, Reinhardt R, Blggel M, Meyer HE, Anselmetti D.
Ultrasensitive detection of unstained proteins in acrylamide gels by
native UV fluorescence. Anal Chem. 2003 Jan 1;75(1):157-9.
