 ne reason people dislike reading books full of equations is that they don't know how to
relate them to anything real. Often, even if they can follow the derivation, at
the end they just get another equation that seems to have no physical meaning. The author
proudly says, “And here is the final result!”, the chapter ends, and the
student is underwhelmed.
If that happens, you're doing it wrong. When reading a book with equations, you should be getting a solid concept of what the things being described are doing to each other. Math is nothing more than a concise shorthand for describing relationships between objects. As a wise woman once said, math is hard. But so was language before we learned it.

Mathematical Equations after a tough study session
In this article I'll show you how to read complicated equations, and what's more important, to understand them. The way I describe certainly isn't the only way—many mathematicians don't visualise at all, and it doesn't work for every equation—but it's how many people do it.
Reading a technical book is fundamentally different from reading a novel. The first goal is to understand it. The second goal is to decide whether to keep reading or to pick up another book and get more details so you can figure out what it really means. The end result is that you often bounce from one book to another. Unlike a mystery novel, the goal isn't to blast through the book to see how it ends; the goal is to learn stuff.
The method I use involves breaking the equation down into chunks and visualizing what the relationship between variables looks like. There are six steps:
Decide which of the terms are constants and which contain variables.
Ignore the constants. They're just decoration that will scale the result up or down. Usually the text will tell you what they mean. Physicists often get tired of writing all the constants over and over, so they just set them all to 1.
Break each term down and visualize what it would look like when plotted on an x-y graph. There are some things that crop up over and over in formulas. These are easy to memorize. (Mathematicians sometimes claim they never memorize, but they're lying.)
1. Geometric curves. A term with only constants is just a scale factor or something that shifts the curve in some direction. A term with only one variable and some constants is just a straight line. An x2 term would look like a parabola. And so on. Your task is to figure out whether the curve goes up or down, and whether it passes through the origin.
2. Exponentials. ex is a curve going up, e−x is a curve going down.
3. Sine waves. Sometimes sines, cosines, etc. are spelled out explicitly, but more often they're written with imaginary numbers, that is, with ‘i’. An equation with an e−ix, for example, is usually not an exponential but a sine wave.
4. Bessel, Laplace, Gaussian, Airy functions, dot and cross product. These have characteristic shapes or actions that you should memorize. They are the alphabet of math.
5. If the term is in the denominator, flip the curve vertically in your mind.
6. Integrals. Take the sum of all the stuff behind the integration sign. For instance, if it's a squiggly curve, you'd visualize a curve inching up or down.
7. Differentials. These you wouldn't normally visualize (though you could); all you need to know is that instead of the variable, the equation is telling you what happens when the variable changes.
Add or subtract the terms as the equation says, and visualize what would happen to the curve.
Make note of special types of variables. For example, it might be a vector or matrix. If it's a vector, the equation is telling you how its length and direction change. With matrices and tensors, visualizing it is a little tougher: you have to do it in three dimensions.
Go back and look at the constants to see how it scales.
Let's start with a simple example.
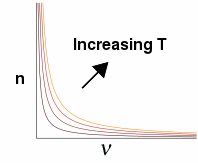
 Your variable is ν, and there's no i and no minus sign, so the exponential part
is a curve bending up. But it's in the denominator, so it's flipped vertically (which
is equivalent to making the sign minus). In physics books, T almost always means
temperature, which is a variable too, so we will have a family of curves. In this
case T is in a denominator, so a bigger T makes the exponential curve go up less.
That means when the equation is flipped, T will make the curve go up more. So you
should be visualizing something like this:
 That's it. That's all most people get from reading equations: a visual or conceptual
picture in their mind of what the relationship looks like, and way the other variable
changes how the curve goes. Often it helps to plot the curves on the computer to make
sure your reasoning is correct.
Let's take a slightly more complicated equation. This one is eq 5.11 for the
response of a bolometer from Tools of Radio Astronomy, 6e, page 95. A
bolometer is a tiny thermometer, usually a thermistor, that's used to detect radio
waves and infrared light. Some newer ones are made of graphene, which means they
are cool.
Here's the equation.

This one tells us how the electrical signal from a bolometer varies with temperature T and chopper frequency ν over a narrow band of frequencies. This is important to know because, in case you ever went out and bought a bolometer, you'd want to know what kinds of signals you'd get out of it.
Notice it has the same exponential as the previous equation, so if you'd skipped over that first one in the text, you'd be really stumped by this one.
- First, identify the variables. There's ν in two places, and also Ω, which the author tells us is the area of your antenna, which is a constant. So all that stuff to the left of the integral we will ignore for the moment because they're all constants.
-
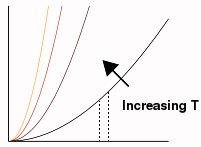
Next, there's that exponential in the denominator that we had before, except now it's
squared, and the numerator is ν to the 4th power. So we'd expect the curves to be a
little more squashed down, and then to shoot up sharply at the right side of the graph.
And that's exactly what they do.

- So for the integral, we'd just visualize some section, such as between those two dotted lines, and think of that area as our answer.
- So whatever that ΔP thing on the left means, it is equal to that little chunk of area multiplied by the size of the antenna (Ω) and A, which the book tells us is the area of the bolometer, both of which are constants, times all that other junk. Lots of times physicists get tired of all the constants and just set them all to 1, so watch out for that.
Visualizing it, you see right away that the signal gets bigger with temperature. The writer would never be able to say this precisely enough in words. The goal for the reader is to be able to look at the equation and recognize conceptually what it does. After a while, you'll be able to do this as easily as reading words.
When you understand what the equation does, you can use it to calculate things. But more often in technical books, it's on to the next equation. Only a tiny handful are really useful, but authors aren't trying impress their colleagues; they're talking in equations. If you skip them, you're skipping most of the book. If it's not clear, it's always safer just to plot them up.
Annoying math tricks
Okay, you might say, that was too easy. What about equations you can't visualize, like matrix equations with hundreds of variables? How do we analyze them babies? And what about Fourier transforms?
Before we get to those, let's talk about those annoying math tricks. Authors really
dislike writing complicated equations, partly because it creates more chances for
mistakes, and partly because short punchy equations look nicer, but mainly because
they know big equations hurt sales of their book. So they might be tempted to simplify
their equation to this:
 This makes it a little tougher to figure out, because you now have to remember that
n isn't a constant, and there's a variable ν hidden inside.
Our authors couldn't do this, though I bet they were tempted; instead, they pulled
an even more annoying trick: they said that hν ≪ kT, which turns this
(their original equation)

into this
 How in the frickin' heck did they get that? Yes, they skipped a bunch of steps that
seemed obvious to them. At least they spared us from telling us how obvious it was, for
which we can be grateful. At this point, we're allowed to take the result as given,
but if we want to follow it we are now forced to do math.
All you can do is start from the clue they gave us (hν is much less than kT). And I could be totally wrong here; I'm sort of guessing what they did.
Here's the trap they set: if hν ≪ kT, we're tempted to say it's zero, which would make the exponential 1 (since e0 = 1). But then the denominator would become 1 − 1 = 0. That would make us divide by zero, which we usually try to avoid (except in quantum mechanics, where it's okay). But a few seconds of playing around with your calculator will show that's not what they did. The exponential is actually 1 + some small number. If you subtract 1 from that, you get just the small number. So now you know what that −1 was for!
So here's what they did (I think):
- From the magic of exponentials, the denominator now changes to (hν/kT)2. We know this from playing with our calculator: if hν / kT was 0.02, e0.02 is 1.0202, which would make the denominator term 0.0202, which is pretty close to hν / kT. So if the exponent is small enough, ex = x and both that pesky exponential and the annoying −1 are totally gone!
- But we're not allowed to get rid of the hν / kT altogether. Even though we got here by assuming that hν / kT is pretty close to 0, setting it to zero would make us divide by zero again. So we can't do that, because dividing by zero is bad.
-
What we have so far is this:

-
We can take most of that junk out of the integral, giving us this (I'm dropping
the integration limits for the moment):

-
You're also supposed to know that c = λν. So when we put back the rest of
those constants, the h2 cancels out, and we substitute the λν
for c. That gives us this (just looking at the constants now):
 Then we integrate, cancel out a couple more ν's,
and do some more stuff to evaluate the definite integral, and voilà, you get
their equation, or something close enough that you can go on with reading the next
513 pages of the book without feeling too guilty.
Phew. I guess I picked a bad example here. Scratch that part above where I said this is easy. The good news is that there are only a finite number of these math tricks. If I get time, I'll create a list of 'em and post them here.
dec 13 2018, 5:40 am
