Improvements and Bugfixes and for xmgr
Xmgr, the standard Linux graph-drawing program, is no longer being maintained, having been replaced by xmgrace. However, the user interface in xmgrace is a challenge to navigate (see here for the contortions I needed to go through to draw a bar graph). So we would like to keep xmgr running as long as possible. As time goes by, the compiler keeps changing, which causes xmgr to crash. Below are the fixes I've found. Also included is a patch to draw bar charts where each bar is a different color. These fixes apply to version 4.1.2. A patched version is available here.
Compiling xmgr in Debian Linux
Xmgr needs a special procedure to get it to compile because the gcc is constantly
changing its implementation of the language, turning old practices into warnings and
warnings into errors. While it's possible to edit the source code to make it compile,
rewriting the entire program isn't necessary. For one thing, you'd have to add an
#include statement to every .c file to include the function prototypes.
Download
xmgr-4.1.2-fixed.tar.gz, which has the function names fixed.Copy
conf/linuxtoconf/ix86-linuxEdit
Make.confto remove-Walland-WpedanticEdit
Make.confto remove-lXp./configureEdit
config.hto make sure it says
#define HAVE_FINITE 1and any other math functions that exist on your systemMake
Below are the changes to xmgr source code that I made.
Cascaded menu crash
On my computer, xmgr crashed at startup before it even puts up a window. The problem is in line 1295 in motifutils.c, where it creates a Motif cascaded menu:
cascadeTmp = XtVaCreateWidget((String) name, xmCascadeButtonWidgetClass, parent,
  	XmNlabelString, str,
    	XmNmnemonic, mnemonic,
    	XmNsubMenuId, menu,
    	0);
Nothing wrong with this line, right? All the strings are properly allocated, and the menus all have reasonable addresses. After staring at this line for about ten minutes, I found a page by a guy named Josep Hornos Arias, who found that substituting NULL for the 0 fixes the problem. It seems that the new compiler no longer treats 0 as a NULL, causing it to crash.
Column Count Incorrect
If xmgr tries to read a file that has more than 30 columns, it says "Column count incorrect." If it tries to read a file with a line longer than 512 characters, it says "Number of items in column incorrect at line ###, line skipped," where ### is a line that exceeds the number of lines in the file.
Solution Increase the value of MAXPLOT in defines.h, increase the value of MAX_LINE_LEN and BUFSIZE in file.c, and recompile xmgr.
Legends dialog crash
Xmgr may crash on some computers if you select the Legends dialog. Edit the file motifutils.c and change line 125 from
while ((s = va_arg(var, char *)) != NULL ) {
to
while ((s = va_arg(var, char *)) != NULL && i<nchoices) {
Legends dialog crash
In x86_64 systems, xmgr also crashes if you open the Symbols submenu under Plot. The fix once again is in motifutils.c, this time on line 174:
while ((s = va_arg(var, char *)) != NULL) {
	retval[i + 2] = XmCreatePushButton(retval[1], s, NULL, 0);
	i++;
    }
The array retval is allocated with only 49 elements. When the array subscript goes past 48, it runs past the end of the array. The solution is the same:
while ((s = va_arg(var, char *)) != NULL && i<nchoices) {
	retval[i + 2] = XmCreatePushButton(retval[1], s, NULL, 0);
	i++;
    }
String modification crash
There's a fiendishly hard to reproduce bug that causes a crash from an attempt to free a null pointer. This happens occasionally when editing a text label in the Edit String box. One possibility is in string_edit_proc in the file strwin.c, where this shows up:
  if( pstr[stringno].s == NULL )
       		free( pstr[stringno].s );
                pstr[stringno].s = (char *)malloc(strlen(tmpstr));
Changing it to this
      	if( pstr[stringno].s != NULL )
        {
       		free( pstr[stringno].s );
        	pstr[stringno].s = (char *)malloc(strlen(tmpstr));
        }
looks closer to what the programmer must have wanted, but there are over 300 unprotected free() statements in the source code, so it's hard to tell if it completely solves the problem.
Setting width of bars in bar graphs / bar charts
Change src/plotone.c to allow the Sym size slider under Symbols/legends apply to the width of the bars.
In the function
void drawsetbar(int gno, int setno, double cset, double bsize)
after the line that says
double tmpy[4];
add these two lines:
   double barwidth = g[cg].p[setno].symsize;

   bsize *= barwidth;
In the function
void drawseterrbar(int gno, int setno, double offsx, double offsy)
after the line that says
w = setlinewidth(wy);
add these two lines:
    double barwidth = g[cg].p[setno].symsize;

    offsx *= barwidth;
Increasing the number of colors
By default xmgr only can plot 16 different colors. Many of these are too light to be usable. So we need more. The solution is to edit defines.h and change maxcolors to 256. I also changed all the following:
| Parameter | Old | New |
|---|---|---|
| MAXGRAPH | 10 | 100 |
| MAX_TICK_LABELS | 40 | 400 |
| MAXBOXES | 50 | 500 |
| MAXLINES | 50 | 500 |
| MAXELLIPSES | 50 | 500 |
| MAXSTR | 100 | 1000 |
| MAXSUM | 47 | 470 |
| MAX_LINESTYLE | 5 | 50 |
| MAX_LINEWIDTH | 10 | 200 |
| MAXCOLORS | 16 | 256 |
Plotting bar graphs in different colors
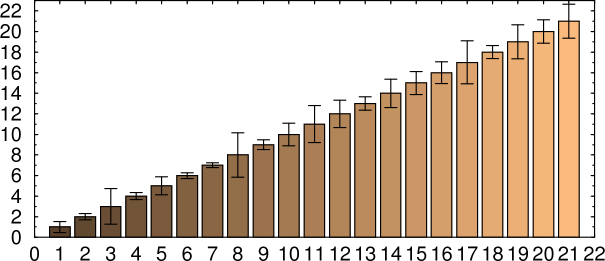
When xmgr creates a bar chart, all the bars in a given data set have the same color. To change that, edit src/plotone.c and modify the drawsetbar function like so:
...
    double tmpx[4];
    double tmpy[4];

/* crude hack to add colors to bar charts */
int hit = 0;
int k=0;
int color[256];
char temp[256];
FILE* fp;

/* get color from text file */
if (fp = fopen("colors", "rt"))
{   hit = 1;
    while (!feof(fp))
    {    fgets(temp, 100, fp);
         if(temp[0] != '#') color[k++] = atoi(temp);
    }
    fclose(fp);
}
/* end of crude hack */

	if (g[gno].p[setno].fillusing == CLRFILLED)
	    c = setcolor(cy);
	else if (g[gno].p[setno].fillusing == PTNFILLED)
	    p = setpattern(py);
    l = setlinestyle(ly);
    w = setlinewidth(wy);
    if (g[gno].p[setno].fill) {
	for (i = 0; i < g[gno].p[setno].len; i++) {

/* set the color for each bar */
if(hit) setcolor(color[i]);
	    tmpx[0] = x[i] + cset * bsize;
...
Then create a text file with the number of the desired color, one on each line. The file below assumes you've also increased MAXCOLORS as described above:
16
18
20
22
...

xmgr with color bar chart
The advantage of this is you can change the color scheme without changing your graph, by simply editing the color file.
A different way is to load the colors as another data set, but leave the Line Style to None. Then change plotone.c like so:
...
    double tmpx[4];
    double tmpy[4];

/* get color from second data set */
int hit = 0;
double offset = 0.0;
double *color;
if (gety(gno, setno+1) != NULL)
{   color = gety(gno, setno+1);
    hit = 1;
    bsize *= 2;       /* make the boxes twice as wide to compensate  */
    offset = 0.25;    /* amount to move the outline */
}

	if (g[gno].p[setno].fillusing == CLRFILLED)
	    c = setcolor(cy);
	else if (g[gno].p[setno].fillusing == PTNFILLED)
	    p = setpattern(py);
    l = setlinestyle(ly);
    w = setlinewidth(wy);
    if (g[gno].p[setno].fill) {
	for (i = 0; i < g[gno].p[setno].len; i++) {

/* set the color for each bar */
if(hit) setcolor(color[i]);

	    tmpx[0] = x[i] + cset * bsize;
...
This produces exactly the same result, but has the advantage of keeping the bar colors in the same file as the graph. To make the outline and error bars line up, you need to change the coordinates in two places:
	    tmpx[0] = x[i] + (cset + offset) * bsize;
	    tmpy[0] = 0.0;
	    tmpx[1] = x[i] + (cset + offset) * bsize;
	    tmpy[1] = y[i];
	    tmpx[2] = x[i] + (cset + 1.0 + offset) * bsize;
	    tmpy[2] = y[i];
	    tmpx[3] = x[i] + (cset + 1.0 + offset) * bsize;
	    tmpy[3] = 0.0;
This is a lot more trouble, but it avoids the problem of the graph colors changing
if it's in a directory with a different colors file.
xmgr configure script problem
Some versions of xmgr bomb out in the configure step. Solution: edit src/pars.yacc and remove the line containing "LOG2"
Stopping extra screen redraws
If you re-size the xmgr window, it re-draws the graph numerous times because the software doesn't handle Expose events correctly. The fix is very simple. Edit events.c and add the following line in the refresh() function after the line that says
} else {
    int w, h;
if (cbs->event->xexpose.count != 0) return;
Setting upper and lower error bars to different colors
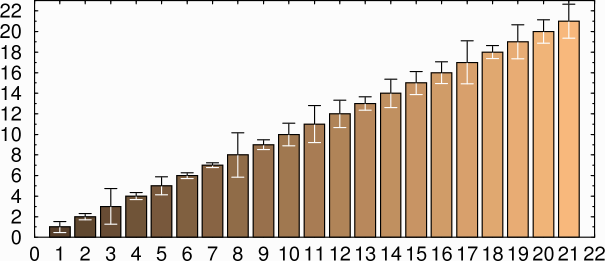
In a bar chart, if the bars are set to a dark color the lower error bar is hard to see. It's desirable to set the lower error bar to white instead of black. Here is how to do it (line numbers are for ver. 4.1.2).
1. Edit symwin.c and change the label in define_errbar_popup line 1074 from "Top/left" to "Top=black bottom=white".
2. Edit plotone.c and add the following lines after "draw the riser" in drawseterrbar
in case PLACE_TOP (line 2151):
setcolor(0);

my_move2(x[i] - offsx, y[i] - dy[i]);

my_draw2(x[i] - offsx, y[i] + dx[i]);

setcolor(1);
3. In the same function, after "draw the bar" in case PLACE_TOP add the following lines
(now line 2221):
setcolor(0);

errorbar(x[i] - offsx, y[i] - dy[i], ebarlen, 1);

errorbar(x[i] - offsx, y[i] + dx[i], ebarlen, 1);

setcolor(1);
The lower error bar will now be drawn in white instead of being skipped when you set Top=black bottom=white in the Display drop-down menu in the Error Bars dialog.

xmgr with different upper and lower error bars
Setting predefined colors
The colors are set in initialize_cms_data(), which is in draw.c.
They're just three arrays red[], green[], and blue[]. So, for instance,
if you want to set the last 64 colors to 64 shades of grey, you could
add the lines:
 for (i = maxcolors-64; i<maxcolors; i++) {

     red[i]   = 4*(i+maxcolors-64);

     green[i] = 4*(i+maxcolors-64);

     blue[i]  = 4*(i+maxcolors-64);

    }
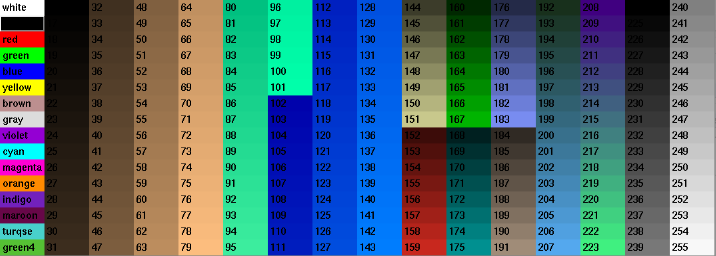
Here is the color palette that I use:

xmgr color palette
    del = (maxcolors - 16) / 3;
    for (i = 16; i < maxcolors-96; i++) {
	red[i] = (i - 16) * 4 * ((i - 16) < del);
	green[i] = (i - 16) * 3 * ((i - 16) < 2 * del);
	blue[i] = (i - 16) * 2 * ((i - 16) <= maxcolors);
    }

    for (i = 144; i<152; i++) {
        red[i] =   20*(i+3-144);
        green[i] = 20*(i+3-144);
	blue[i]  = 14*(i+3-144);
    }
    for (i = 152; i<160; i++) {
        red[i] =   20*(i+3-152);
        green[i] =  4*(i+3-152);
	blue[i]  =  3*(i+3-152);
    }


    for (i = 160; i<168; i++) {
        red[i] =   0;
        green[i] = 20*(i+2-160);
	blue[i]  = 0;
    }
    for (i = 168; i<176; i++) {
        red[i] =   0;
        green[i] = 16*(i+2-168);
	blue[i]  = 16*(i+2-168);
    }

    for (i = 176; i<184; i++) {
        red[i] =   12*(i+3-176);
        green[i] = 14*(i+3-176);
	blue[i]  = 24*(i+3-176);
    }
    for (i = 184; i<192; i++) {
        red[i] =   16*(i+3-184);
        green[i] = 14*(i+3-184);
	blue[i]  = 12*(i+3-184);
    }
    for (i = 192; i<208; i++) {
        red[i] =    4*(i+6-192);
        green[i] =  8*(i+6-192);
	blue[i]  = 14*(i+2-192);
    }

    for (i = 208; i<256; i++) {
        red[i] =   64;
        green[i] = 16*(i-maxcolors+96);
	blue[i]  = 128;
    }
    for (i = maxcolors-32; i<maxcolors; i++) {
	red[i]   = 8*(i+maxcolors-32);
	green[i] = 8*(i+maxcolors-32);
	blue[i]  = 8*(i+maxcolors-32);
    }
Printing plusminus (±) sign
You can create a plus/minus sign in xmgr by entering \95. Unfortunately,
when you print it doesn't come out correctly. One solution is to edit the PostScript
and enter a \261, i.e.
(\261) show. Other characters are one-fourth (¼) = \274 and
one half (½) = \275. Whether this works or not depends on the Iso definitions
elsewhere in the PostScript file. I've verified that it works if your xmgr string
is in Helvetica.
Handling data files that contain strings
Data files often contain strings along with numbers, as in this line:
"44h028" "control" 1 1804289383
These cause problems, as xmgr acts unpredictably with them. To make them readable as
block data, edit files.c and change the first line in function
readblockdata to this:
int i = 0, j, k, ncols = 0, pstat, jj, quote=0;Then add a short loop near the top of the while loop:
    while ((s = fgets(buf, MAX_LINE_LEN, fp)) != NULL) {
	readline++;

        /* replace quoted strings with zeroes */
        quote=0;
        for(jj=0; jj<strlen(buf); jj++)
        {
            if(buf[jj]=='"'){ quote = 1-quote; buf[jj]='0'; }
            if(quote) buf[jj]='0';
        }
Similar changes could be made to other data reading functions. This will change any string to a zero without messing up the number of columns. The example above becomes
00000000 000000000 1 1804289383
Other sources of information
M. Lund also has a repository of patched xmgr 4.1.2 including a cmake build system at https://github.com/mlund/xmgr-resurrection.
