 irst it was oil. Then it was food, and metals,
phosphorus,
and even water. Then it was
sand.
Then, according to the
New
York Post(warning:may crash browser) and Gizmodo, we're also running out of
helium, sardines, goat cheese, bacon, wine, chocolate, and tequila.
No bacon and no way to give yourself a squeaky high-pitched voice: a grim future indeed! But as if that weren't bad enough, according to economists at the National Bureau of Economic Research (NBER), now we're also running out of ideas.[1]
Here's their argument: it takes 18 times as many ‘researchers’ to double chip density today than in the 1970s. Conclusion: research productivity in chip design is declining 6.8% per year. Research productivity for seed yields is declining at 5% per year. Likewise for mortality improvements in cancer and heart disease.
Their conclusion is that research productivity for the aggregate US economy has declined 5% per year, for a factor of 41 since the 1930s. They suggest that there's a causal effect: the massive decrease in productivity is caused by the fact that research effort is rising so sharply. In other words, too many researchers.
There's only one problem: their conclusion doesn't follow. It's based on the assumption that a linear increase in research automatically causes an exponential growth in the economy. In fact, that's how they define it.
This assumption is expressed by their equation (1).

The term on the left is the relative rate of economic growth. St is the number of ‘scientists’ and α is the research productivity. This equation is their null hypothesis and it assumes that the growth rate is directly proportional to the number of scientists times their productivity.

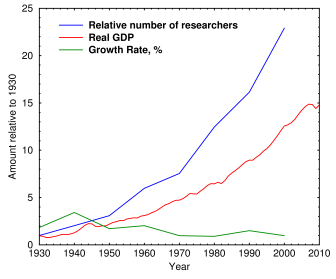
Fig. 1. Growth of GDP and Researchers 1930 to 2010. Number of researchers is relative to 1930 = 1.0 (from [1]). Real GDP is in trillions of US dollars, adjusted for inflation using 2009 dollars. Source. Original data: BEA, National Income and Product Accounts Tables: Table 1.1.5. Nominal GDP, Table 1.1.1. GDP Growth Rate. Table 1.1.6 Real Gross Domestic Product.

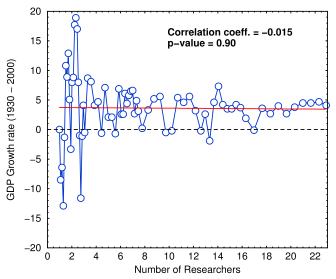
Fig. 2. Growth rate vs number of researchers (calculated from red and green curves in Fig. 1).
They plot a curve showing the growth rate as a horizontal line, while the number of researchers has increased by a factor of 25 (green and blue lines in Fig. 1). The conclusion that research productivity decreased by a factor of 41, for an average growth rate of −5.1% per year, is based entirely on the assumption that linear increases in the number of scientists should produce a linear increase in the growth rate and thereby cause an exponential increase in growth.
If we take their data and plot the number of researchers vs. growth rate, we get a curve with a slight negative slope (Fig. 2). Granted, this analysis is tricky because of possible time delays between the invention and the change in growth rate. Nonetheless, the correlation is not statistically significant even when the data are binned into ten-year intervals. But in economics, unlike everywhere else in science, a non-significant correlation doesn't mean the two variables are unrelated. It means that something really terrible has happened—one of the variables has been totally wiped out. The equation can't be wrong; the productivity must have dropped precipitously. We're running out of ideas!
When we remove that assumption, and instead suppose that innovation linearly increases GDP, we can see that the actual discrepancy is a factor of 0.547, or about −0.75% per year (red line in Fig. 1; no need to normalize GDP since real GDP was close to $1T in 1930). What's more, now innovation correlates with research.
So in a better (though still questionable) model, the decrease is 74.87 times smaller than what these researchers in the dismal science claim. It means that their initial null hypothesis was false. They should be happy.
In fact the idea that research doesn't always translate into economic growth makes sense: if a researcher discovers something, it might lead to an increase in the growth rate, or it might not. It might even harm growth, depending on what the invention does.
But (assuming their data are right) there's still a decrease. What could be causing it?
They argue that it's not just a result of ideas becoming mature: ideas should generate new products as well as improve old ones. They talk about Moore's law and claim that it's 18 times harder today to keep Moore's law on track than it was in 1971. But again, even if it were true, the assumption that “research” and “ideas” are responsible is highly questionable. Moore's law is more about manufacturing than design.
The same goes for crop yields: research is a minor factor in improving crop yields. Farms are entire ecosystems, which I know almost nothing about, but there's dirt, fertilizer, machinery, and . . . um, cows.
Getting back to research. Suppose each researcher over their lifetime discovers ten important things. If management chooses not to develop nine of them, this does not necessarily mean the researcher was less productive or had fewer ideas. It could mean that companies are becoming more risk-averse (a known factor in pharma research, where the role of FDA regulation and product liability in discouraging new molecular entities (NMEs) is enormous). It could mean that executives are not taking advantage of their own company's research. Or that taxes are too high and they have insufficient funds to launch a new product.
Or maybe science has become more bureaucratic; basic researchers spend far more time writing grant applications than before; or there are structural changes in how labs are run. Or it could mean that researchers are moving to fields that don't translate as effectively toward making profits. Or maybe, as the authors suggest, lab equipment has gotten more expensive. It could be a million things. Running short of ideas is the least likely one.
I've worked in a quasi-commercial research place, and the researchers I've seen come up with new ideas like crazy—if they're allowed to. Whether management can figure out how to turn them into profit is another matter. In my observation, most of any profit goes to pay the patent lawyers—and the managers' salary.
But wait, there's more! How these economists define researcher is not clearly stated. The number of researchers in the graph above is normalized to 1930 = 1.0. But what is a researcher?
Being economists, they use money. A researcher is the research expenditure divided by the wage of a scientist. Higher wages = fewer actual people per “effective scientist.” So, the conclusion seems obvious: scientist wages are too low. They should get a raise. QED.
What this paper really shows is that ideas, especially bad ones that generate scary headlines, are more abundant than ever.
1. Nicholas Bloom, Charles I. Jones, John Van Reenen, and Michael Webb (2017). Are Ideas Getting Harder to Find? NBER Working Paper No. 23782 JEL No. O3,O4
sep 17, 2017; last edited sep 18, 2017, 5:38 am

