 here are many reasons why extraterrestrials would use visible light instead of
radio waves to communicate with us.
No matter what wavelength they use, physics dictates that they'd need a lot of ERP (effective radiated power) to send messages very far. That's where visible light comes in: the shorter the wavelength, the narrower your beam can be, and that beefs up your ERP.
High power isn't even necessary: aliens could communicate by modulating the polarization of the light from their own star. If they used a giant liquid crystal, all they'd need is a little computing power and some thrust to position an LCD. It would be a cheap way to communicate with their astronauts. The alien astronauts would have to track their home star anyway, and they could measure the light easily; they could receive the latest gossip about their movie stars from thousands of light years away.
Of course it would be unidirectional and low speed, and the polarizer would have to be a sizable fraction of the diameter of their sun. But an advanced civilization could build a large Kerr cell easily enough. It would be expensive, but hey, they're aliens; they're rich.
Another way is to use two carriers and encode the information as a phase shift between them. Radio hams use a system like that today called PSK31. On a radio a PSK31 signal sounds like nothing much, just a strange whine; but the scheme is remarkably noise resistant, and it's amazing to click on the signal and watch the computer suddenly start printing out text.
So Borra and Trottier's idea (“Discovery of peculiar periodic spectral modulations in a small fraction of solar type stars”, arxiv 1610.030301) of looking for signals like this in stellar spectra makes a certain amount of sense. Here's what they did:
- Grab the Sloan Digital Sky Survey data, which consists of 2½ million visible spectra of individual stars.
- Convert the spectra from wavelength units to frequency units.
- Subtract out the continuous spectrum, which is caused by incandescence, i.e. heat. This is a standard thing; it lets you look at the line spectra, which are caused by electronic absorptions by the various atoms in the star's atmosphere (and also in the interstellar gas, and molecules in our own atmosphere).
- Run an FFT (discrete Fourier transform) on them to convert the spectra to time units instead of frequency.
- Look for spikes in the result.
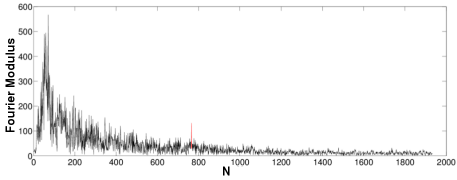
What they found was a spike in 234 of the stars. Here is one, from Figure 3 in their paper.

Fourier transformed signal from a star (peak from ‘aliens’ highlighted in red)
The authors say that one unit in the FFT corresponds to 2.1538×10⁻¹⁵ sec, so this peak at 765 units means whatever caused it was 765 times that, or about 1.6477×10⁻¹² sec. This corresponds to a frequency of 606.9 GHz which is at 494 μm—in the far infrared.
Now this is all very clever—I use optical spectra created by FFT every day in the lab, but it would never have occurred to me to transform it back and look at it in the time domain—but right away there are some oddities in the result.
Almost every single positive was at exactly 765. But the Sloan spectra are not corrected for redshifting, only for the Earth's doppler shift; measuring actual redshifts is one of the main reasons for Sloan's existence. Why wouldn't redshifting have moved that peak around? There are three possibilities:
- The aliens are all at the same distance from Earth.
- The aliens, being part of a Federation of Planets, coordinated with each other to synchronize the wavelengths that they beam toward Earth.
- The spectrograph has insufficient resolution, making the redshift irrelevant for nearby objects, and only nearby objects were observed.
The authors go for option #3. They say, in effect, they lucked out and the wavelengths measured by Sloan happened to line up in a bin instead of at the edge of one. If they'd been unlucky, the peak would be between bins and harder to detect.
Redshift is easy to calculate: the authors used Data Release 8 (the current release is 13). In Data Release 8 the spectra were measured from 3800 to 9200A on up to 4096 pixels. There were 3900 data points in the frequency domain, so each pixel was 1.385Å (Angstroms), making the theoretical resolution (R) equal to 5,057 at 700 nm. But due to other factors the actual resolution was only around 2000, which is pretty low. The interpolation they needed to do to make the frequencies evenly spaced for the FFT software cut the number of data points per spectrum down to 1950, reducing it even more.
Redshift is given by

which is related to distance by the formula

where c (the speed of light) is 300,000,000 m/sec and
the Hubble constant H0 = 0.0215 m/sec/light-year. So a redshift
of 1 pixel is 1.385Å
( = 0.1385 nm) at 1000 nm and z = 0.0001385, which corresponds to a distance of 1.9
million light years. Most everything in the Milky Way would be in the same bin, so
the answer is #3.
Why is there a peak?
But what could explain that weird spike? Remember that they're seeing a sharp peak in an FFT, which means there is a smooth periodic feature, like a ripple, in the original spectrum. Anything that creates that, like the fact that they're using a Cassegrain optical system (see here), might cause that. Edge effects in Cassegrains cause diffraction artifacts; even a small variability might disrupt it enough to make the peak smaller in some spectra and larger in others. Another factor is the need to interpolate numbers when converting from wavelength to frequency. This could introduce periodicity into the data. Conversely, anything that's sharp in the original, like absorption lines, if they were evenly spaced, could give peaks in the FFT, but they'd be broad.
The authors thought of all these possibilities. Their main argument is that any systematic artifacts, such as from their interpolation calculations or from a damaged fiber optic cable, would have to be in every star.
Their idea is that it could be a signal from an infrared laser (outside the range of the spectrometer, otherwise they'd see it) modulating the visible light. But it seems unlikely that all 234 alien civilizations would have picked exactly the same wavelength to communicate with. So it seems to me more likely to be an instrument problem like a grating artifact, a row of hot pixels, some inaccuracy in the flat field step, or something in their calculations that somehow only affected a few spectra.
They didn't see the peak in any galaxy spectra, but that's not surprising since the absorption lines are going to be broader in a galaxy. Galaxy spectra would have been helpful as they would be far enough away to be redshifted into another bin, supporting their claim. But then any alien communications would be washed out as well.

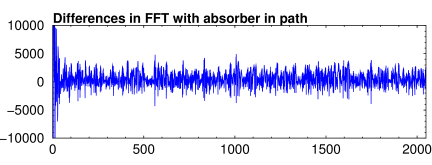
Spikes introduced into Fourier transformed random data by a simulated absorber in the path
But really, FFTs are tricky. Anything that wipes out a broad section of the spectrum, like dust, can cause a sharp peak in the FFT. Just for kicks, I generated some random numbers and added a simulated 1% wavelength-dependent absorbance in one copy, ran an FFT on both sets and subtracted their moduli. Of course my function is not a real absorber. But it shows that a small amount of absorbance can create a surprising amount of junk in the FFT (see figure at right).
A rule of thumb in science is if you have to use statistics to see it, it's not really there. The best statistics can do is prove that something you see is not real. So all these complicated arguments, including my graph, really mean little: the peak looks like it's there and in need of explanation. What they ought to do is to repeat the measurements on those 234 stars, preferably with different equipment and a higher resolution spectrograph, to see if they get the same result. And that's exactly what they say they plan to do.
Last edited nov 08, 2016 4:37 pm

