 any people view densitometry as an obstacle to overcome: how can I get
publishable numbers that confirm what I can see visually in the blot?
An example is
this
poor guy. His Western blot had little spots all over, areas of both
over- and under-saturation, and bands that were badly smeared. Yet there
was a clear band in there, which is all most researchers really care about.
The answer everyone gave him was: do the experiment over and stop using Photoshop. That's good advice. Unfortunately, there's also a lot of bad advice on the Internet and out-of-date advice in the scientific literature. There are many free programs that can do densitometry, but there's no substitute for understanding what your imager is doing. Doing Westerns without this knowledge can be a disaster for your lab.
Image types
There are three main image formats you may encounter in different imagers. They're indistinguishable to the eye. Some are usable for densitometry and some are not.
Pseudocolor (aka indexed color): The software maps the most abundant 256 colors into a color palette and saves it with the image. Rarely seen now; don't use.
Grayscale: The image contains a single channel containing only intensity values. A pixel depth of 8 bits means it has 256 distinct pixel values; 16 bits means 65536 and 24 bits means 16,777,216. (24 bit grayscale is rare today but will likely become the standard in the future.) Grayscale is ideal to use if 16 bits/pixel or higher.
Color: The image contains separate channels for each color. A 24-bit color image has three channels (R, G, and B) with 8 bits/channel. A 48-bit color image has three channels with 16 bits/channel. There are also 8-bit indexed color images in which the colormap is set to show different intensities of a single color. Densitometry is rarely done on color images because of the need to separate the three channels.
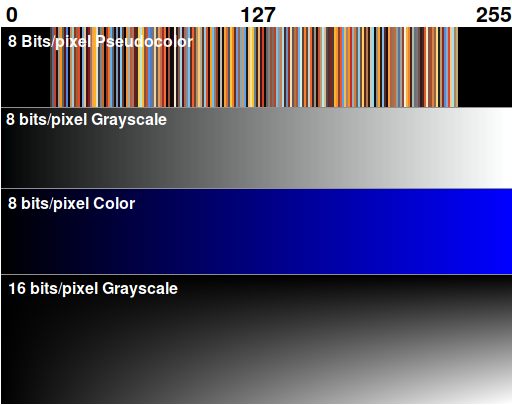
Image types
The most important number is the bits/channel. This determines the dynamic range. For scientific imaging, the only acceptable number is 16 bits/channel or higher.
Image file formats
There are many image file formats you may encounter.
| Format | Acceptable | Remarks |
|---|---|---|
| TIF | Yes | Universal format |
| SCN | Yes | Specific to Biorad |
| PNG | Maybe | Software may not tell you if it's using 8 or 16 bits |
| BMP | No | Might work but is old, quirky |
| JPG | No | Lossy compression, loses information |
| GIF | No | Almost always pseudocolor |
| AVIF | No | Highly compressed |
| FITS | Yes | Not all software handles it |
Tiff is clearly the best choice. However, there are some caveats:
Just because an image appears to be shades of gray doesn't mean it's a grayscale image. You have to open it with software that can identify the pixel format.
Tiff and PNG files can be any number of bits or color types. You can't rely on the file type; it's necessary to know the pixel depth. For example, a Tiff from a cell phone would not be suitable for any scientific purpose.
Many scanners have misleading menu options. If the options are “Publication Quality” and “Raw,” always choose Raw. Publication Quality means 24 bits/pixel, 8 bits / channel RGB, which is okay for publication but inadequate for densitometry or archiving. When manufacturers dumb down the software by hiding these details, it might make users feel better, but it causes big problems because users don't understand what it's doing. They will select whichever sounds nicer and end up getting bad results.
Some software calls the option “Export to Analyze” or “Export for Analysis.”
Most popular software including MS Word, PowerPoint, and Acrobat automatically converts any 16-bit images into 24 bit/pixel, 8 bit/channel RGB. This means you can never do densitometry on an image extracted from a PDF, ppt, or .docx file. Once an image has been down-converted to 8 bits/channel, the information and dynamic range are lost forever and cannot be recovered.
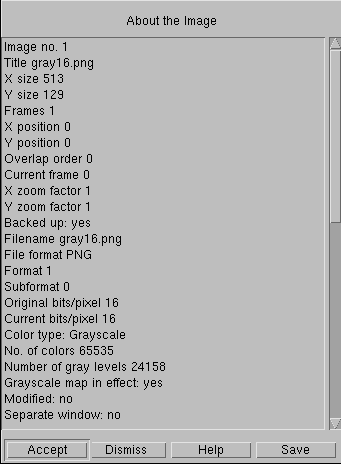
Partial display of About The Image window in Imal
The take-away message is this: make sure your images are being captured and archived in a suitable format. This raises the question of how you can tell what format you have. At right is the About the Image window in Imal, a powerful (and free) densitometry software for Linux. The important parameters are the Current bits/pixel (16) and the Number of gray levels (24,158 in this image). Most other software has something similar.
How to tell if your image is good enough
Pixel depth isn't the only criterion. Another important thing to consider is saturation.
In some software you can simply click a button to tell it to highlight any bands that are saturated. Undersaturated bands will then be shown as blue and oversaturated bands shown as red. In either case, if there are saturated pixels the image cannot be analyzed. If you tried, all of your bands would be falsely indicated as nearly the same. If you published an image like that, your results would be incorrect and the journal would eventually retract your paper.
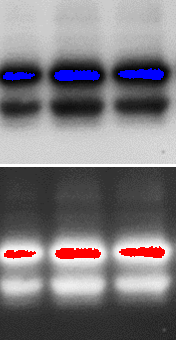
Under- and Oversaturated Western blots
I once had a collaborator to whom this happened. They thought their bands should be as dark as possible, so they used PhotoShop to make them totally black, then tried to do densitometry on them. Then they asked me for help when the journal said it was retracting their paper. It took some doing to convince the journal, but the authors eventually found the original 16-bit images that were still sitting on their scanner and saved their paper. It turned out they had been analyzing their data incorrectly and publishing incorrect results for years. This wouldn't have happened if the software had made it clearer what they should do.

A good histogram
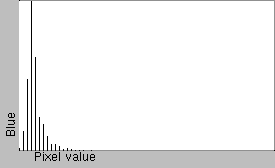
A bad histogram. Only 17 different intensity values are present, indicating a very low dynamic range, which makes it useless for densitometry. This is a typical result from an 8 bit/pixel image
In ImageJ, there is no way to highlight saturated pixels, so you have to check each band manually by hovering over it with the mouse and reading the pixel value. This is a good practice anyway, because an image could max out at any value, not just 0 or 65535.
Another test that's good to run is a histogram. Below is a histogram of a 16-bit grayscale image that was recently published. The vertical black lines show the number of pixels for each pixel value. This histogram shows two desirable features: a continuous pattern with no gaps, and a measurable count over a wide range. If your histogram shows only a few widely spaced vertical lines, it means your image has been incorrectly processed at some point, most likely by conversion to a lower pixel depth. Or it might even be a screen grab of somebody's image.
Chemical saturation
Chemical saturation is another thing to watch out for. It can occur when using chemiluminescence or colorimetric staining. This is different from image saturation and it's particularly nasty, as it might not saturate the camera sensor and so it wouldn't show up when you highlight the saturated pixels. Luckily, the chemistry of chemiluminescence gives you a clue: if the band appears “hollow” it means you've depleted your chemi substrate and the signal is starting to fade in the most strongly stained areas. If this happens, you have to restain it.
The nice thing about infrared fluorescence staining is that it's immune from depletion of substrate. Your blots will also last forever, so you can image them again if necessary (for instance, if your hard drive crashes and you don't have backups). Although you can often also re-image a chemi blot, it's usually necessary to strip and restain it first.
The worst method of all is film: film is highly nonlinear and totally unsuitable for densitometry. It's also a nightmare to keep the chemicals needed to develop a film consistent. In the old days, we'd have a special company come in and take away the old developer chemicals (and to clean out the broken glass caused by people who, for some reason, kept putting microscope slides through the film processor). If you're using film, please stop, as it's slower, messier, less linear, and less sensitive than a CCD imager.
How to do densitometry on a Western blot
There are three basic ways of doing densitometry: vertical strip, horizontal strip, and spot densitometry. We'll discuss all three, using the Linux Imal software as an example.
Spot densitometry
In spot densitometry, you first decide whether your maximum signal is black or white. Then you select the size of your band and click on the band. (There are many other options, including finding bands automatically). The figure below shows a typical result in Imal. It prints a big table showing the calculations for each band, then shows the results in another table. You're mainly interested in the last column (Signal − Background).
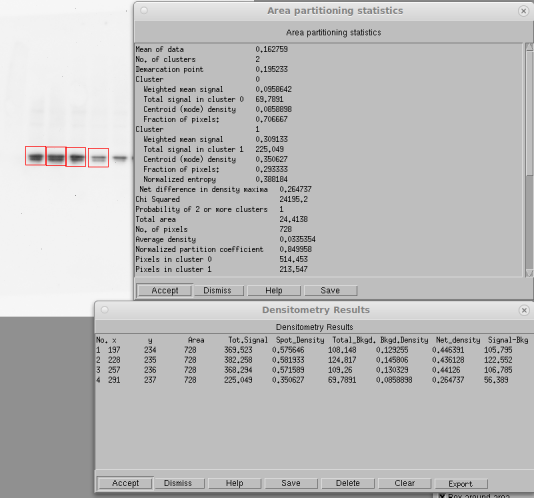
Spot densitometry for Westerns (resized screen grab)
In this example, the total signal in band 4 without background subtraction is 60.9% of that in band 1. With background subtraction, it is 53.3%. If the background were darker, the difference would be even greater, as it should be.
Notice what the software's doing here. Some software doesn't subtract any background, so it gives an accurate result only if the background is completely white. Other software just picks a background value more or less at random and uses that. This works if the background is completely uniform, but it never really is. What you really want is the local background around the spot. This is why Imal does this partitioning analysis. To measure a band, define a box (shown in red) that includes some of the background. The algorithm will then do a fuzzy k-means statistical analysis to separate all the numbers into two clusters. For a perfect image, it wouldn't matter. In the real world, it gives a much better result.
Vertical strip densitometry
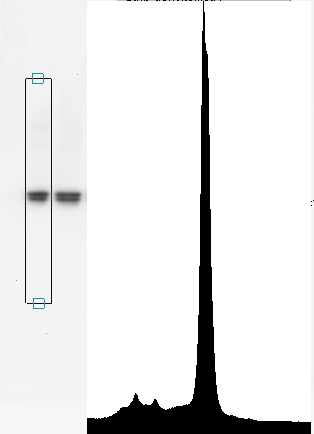
Vertical strip densitometry
In vertical strip densitometry, you set the width of your band, then click on the image to define two points more or less vertically. The software gives you a strip of data resembling a chromatogram and plots it in a graph as shown here. This tells you if there are smaller bands above or below the band of interest. You can click a button to remove the baseline automatically, or you can remove it manually. Then drag the mouse on the band of interest to measure its area. This gives you high confidence that the background within the lane is correctly eliminated.
The advantage of this method is that if there are two or more bands, it's easy to get a ratio. A single click lets you save the densitometry trace in a text file for plotting by some other software. The dialog box for saving the densitometric trace isn't shown here.
Horizontal strip densitometry
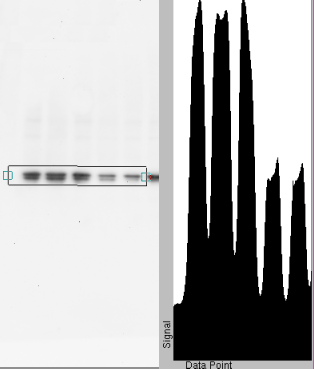
Horizontal strip densitometry
Sometimes you already know which band you want, in which case it's easier to scan horizontally. This gives a series of rectangular peaks as plotted here. Again, you subtract the baseline and drag the mouse across each rectangle to measure the area. This method gives you a profile of each band as well as a densitometric value. The profile can be saved and it is very valuable in forensic analysis, as it can tell you if something was done improperly. (The images on this page have been resized to fit the web page, so it may be hard to see).
Dot blots
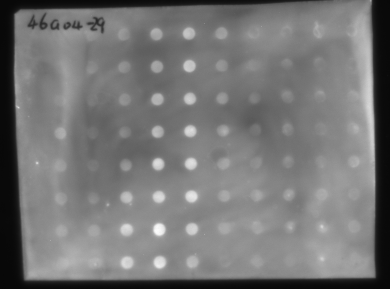
Dot blot
Dot blots are also easy to analyze in Imal, even if you have a high and variable background as is shown here. For this blot, you'd select Spot Densitometry and Manual (Circle). Set the Diameter to include a roughly equal amount of spot and background, and check “Auto bkgd/fuzzy k means.” When you click on a spot, Imal will perform the detailed statistical analysis and give you Signal minus Background.
Or you can just leave Auto Bkgd off and do the densitometry without correcting for background, as most other software does. In this case, Imal will give you the same result as a commercial package, though it means a lot more work trying to get a perfect dot blot.
Summary
All three densitometric methods remove the background in different ways. But what if the noise is just too much? This sometimes happens on dot blots like the one above, where we accidentally wrote the experiment number over one of the spots, or maybe you just want to troubleshoot the method. Or there may be suspicions about the image. In these cases, there are a variety of forensic tests, including filtering, that can give you clues, discover image tampering, and find hidden features in your data. Of course you can't publish a filtered image, but filtering can save weeks of work by telling you if there's anything there. Which, in my opinion, should be the goal of science.
sep 19 2023, 4:05 am

