 n this article I will describe what image deconvolution does and why it's
important. I will also describe in detail how to do a deconvolution in the
freeware Linux package Imal (v. 4.0.0 or higher)
and compare the results with Fourier-space filtering.
Deconvolution is just what it sounds like: disentangling two images. It's usually done in Fourier space, where each point represents a spatial frequency. There are two equivalent ways of deconvoluting:
Manually deleting the unwanted spatial frequencies. This is called Fourier-space filtering. The image is transformed by FFT (fast Fourier transform) into a set of frequencies, the unwanted ones are deleted, and the image is recovered by reverse FFT.
Using a point spread function (PSF) to generate a list of unwanted frequencies that can be deleted automatically. This is called deconvolution. The two most commonly used methods are Fourier deconvolution and Richardson-Lucy deconvolution. The second is less powerful but faster, which means it's more commonly used in large sets of images.
 While we usually think of image deconvolution as a way of sharpening an
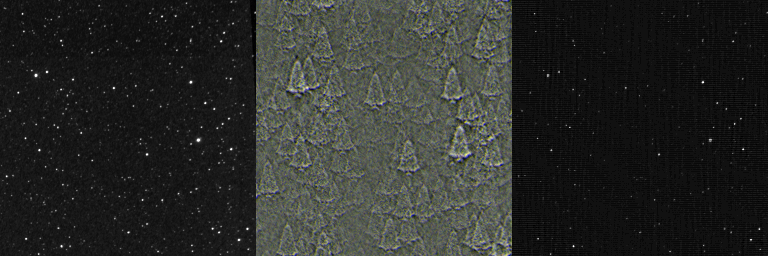
image, it doesn't have to be. In Fig. 1, a star field was convoluted
with the image of a Christmas tree shown at right. This turns each non-zero
pixel value into a separate tree whose brightness is proportional to the
brightness of the original pixel. To restore this image, we have to use the
Christmas tree as our PSF. When that is done, we recover the original star
field, though the signal to noise ratio is lower than the original image.
The PSF represents what happens to a single pixel when the image became blurred. Perfect reconstruction is only possible when the PSF exactly matches whatever caused the distortion.

Fig. 1 Image convolution does not necessarily mean blurring.
Left Star field near Veil Nebula in Cygnus. Images in this figure
were processed as 16-bit grayscale images.
Center Star field convoluted with an image of a Christmas tree.
Every pixel becomes a small overlapping Christmas tree. The brightness
of the tree is proportional to the brightness of the original pixel.
Right After Fourier deconvolution using a Christmas tree as a
deconvolution kernel, the original star field image was
recovered, but small amounts of noise are still present.
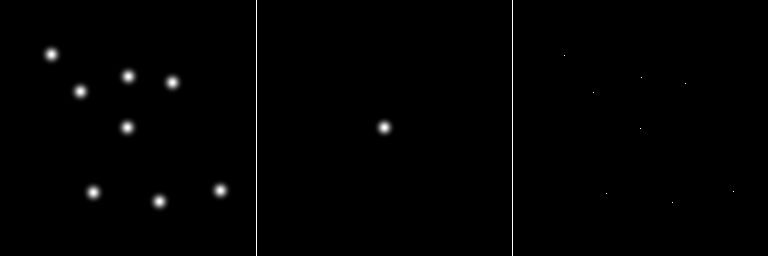
Fig. 2 is an example of an artificially created image of eight blurred dots. If we wanted to do Fourier deconvolution, the PSF (middle image) would be a blurred image of a single dot. Normally the PSF is centered in the center of the image. If it were at some other location, a translation would also be introduced into the image. Because in this case the PSF was known in advance, Fourier deconvolution worked well. It converted the image back to a set of eight points, shown at right. Although this example looks perfect, there are actually very faint noise bands in the deconvoluted image.
Needless to say, it is rare to get results like this with real images. In the real world, the PSF is never exactly known. In some cases, manual filtering gives a better result.

Fig. 2 An ideal artificial case of FFT deconvolution
Left Original random blurry spots. This image and the kernel (center)
were processed as 16-bit grayscale images.
Center 256 x 256 PSF kernel for de-blurring by deconvolution
Right After Fourier deconvolution. The fuzzy disks have all been
changed to one-pixel-diameter dots. This rarely happens on a real image.
Display scale = black −2.5e6, white = +2.1e9.
What a 2D FFT looks like
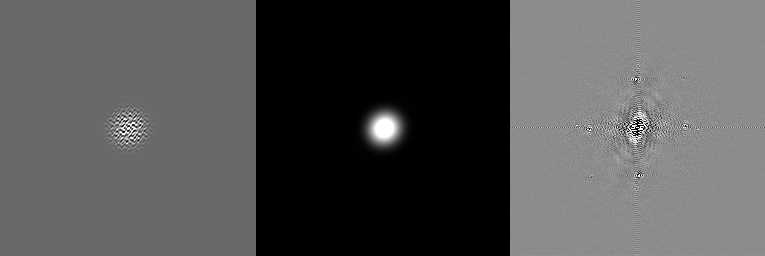
Below are some examples of images in Fourier space. The left two images in Fig. 3 are the 2D FFTs of the eight blurred spots and of the blurring kernel in Fig. 2. This pattern—bright in the center and gray throughout the remainder—is typical of asymmetrical images such as the one in the left of Fig. 2. Since the PSF kernel is perfectly symmetrical, there are no frequencies below a certain value, so the background of the FFT of the PSF (center panel) appears black. The way these 2D-FFTs are displayed, with the highest frequencies in the center, is the most common standard for FFTs. The lowest frequency, called the DC offset, is in the upper left corner. The DC offset represents the average brightness of the original image.
Notice that a Fourier transform creates a set of complex numbers, so we always have a real component and an imaginary component. These are displayed separately in Imal. It's also possible to display the power spectrum, which is the product of the two.

Fig. 3 Example 2D FFTs
Left FFT of the random spots image in Fig. 2 left.
Center FFT of deconvolution PSF in Fig. 2 center. It appears larger
than the original because of how the FFT values are mapped to the screen,
but it is still roughly a Gaussian shape, conforming to the fact that a
FFT of a Gaussian is another Gaussian.
Display scale: black = −5e3, white = +4.3e6.
Right FFT (real frequencies shown) of blue channel of a face. The
original is shown in Fig. 4 at left. The four bright spatial frequencies around
the center are a clear signature of aliasing. Display scale: black = −2.2e4,
white = +1.8e4
Manual FFT frequency-space filtering
The easiest way to understand deconvolution is by looking at frequency space filtering.
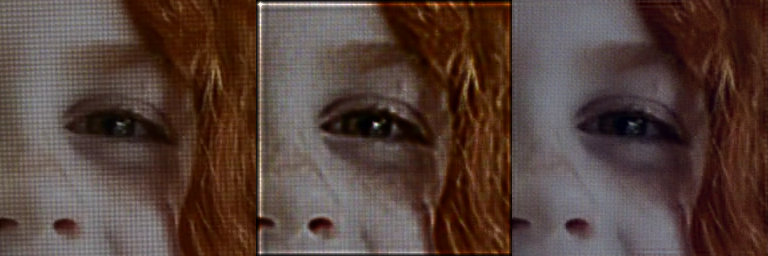
The left panel in Fig. 4 shows an image of a person's face in a TV commercial for a water purifier, photographed by a camera focused on an LCD TV screen. This image is badly corrupted by aliasing, which appears as horizontal and vertical lines on the image, caused by the periodic mismatch of pixels on the TV screen with the pixel elements on the camera's image sensor. If we tried to de-alias the image by low-pass filtering, we'd get rid of the horizontal and vertical lines, but the image would also lose most of its fine detail. The power of deconvolution and frequency-space filtering is that the noise is removed but most of the fine detail is retained.
The Fourier transform of the image of the person's face is shown in the right panel of Fig. 3. The aliasing shows up clearly as strong extraneous frequencies at four points around the center. The center, as mentioned earlier, is the highest frequency, in this case at x=127, y=127. The four bright areas are a characteristic signature of aliasing. In the original, we can see that the aliasing artifacts are about 5.3 pixels apart. Since the image is 256 pixels across, this corresponds to a spatial frequency of 256 / 5.3 = 48.3. Thus, the frequency we want to eliminate is 48.3 pixels from the center, or 127 − 48.3 = 78.7 pixels from the center. The center points of the four unwanted regions are:
  127,  80

  127, 176

   80, 127

  176, 127
To eliminate those frequencies, we will set a 10×10 region around each of the four areas to 0, then reverse-FFT the image. This gives the image shown on the right panel of Fig. 4. Next we will describe in detail how to do that.

Fig. 4 Comparison of Richardson-Lucy deconvolution with manual
Fourier filtering
Left Original color image of a person's face photographed from a TV.
This image has bad aliasing due to periodic mismatch of the pixels on the
TV screen with the pixel elements in the camera sensor. It has been
cropped to show the aliasing.
Center After 4 iterations of Richardson-Lucy deconvolution using
the kernel shown in Fig. 5
Right After manual Fourier filtering using macro in Imal described
below

Fig. 5 The kernel for Richardson-Lucy deconvolution used in the middle panel of Fig. 4 was a small 24-bit RGB color image shown here enlarged 10×
Although it's possible to do all these steps from the menus, doing it in a macro makes it easier to document the steps for future use. Below is an Imal macro for Fourier filtering that eliminates aliasing.
fft(1,1,1,1)

setvalue(70,117,90,137,0)

setvalue(117,70,137,90,0)

setvalue(117,166,137,186,0)

setvalue(166,117,186,137,0)

fft(1,1,0,2)

setvalue(70,117,90,137,0)

setvalue(117,70,137,90,0)

setvalue(117,166,137,186,0)

setvalue(166,117,186,137,0)

fft(1,1,-1,1)

copyfft
This gives a much better result than a simple low-pass filter. Low-pass filtering gets rid of the aliasing but also removes much of the detail. But FFT is more work: it only works on grayscale images. If you have a color one, you have to separate them into R, G, and B components, filter them individually, then recombine them. This is why R-L deconvolution is sometimes preferred, as the PDF kernel can be a color image. R-L deconvolution is faster than the FFT method, but not as powerful.
Suppose we wanted to filter a color image. The complete macro for de-aliasing it would be:
separatergb

tagrgb
fft(1,1,1,1)

setvalue(70,117,90,137,0)

setvalue(117,70,137,90,0)

setvalue(117,166,137,186,0)

setvalue(166,117,186,137,0)

fft(1,1,0,2)

setvalue(70,117,90,137,0)

setvalue(117,70,137,90,0)

setvalue(117,166,137,186,0)

setvalue(166,117,186,137,0)

fft(1,1,-1,1)

copyfft
untagrgb

combineallrgb
Notice how this macro works: it works on the currently selected image
until an image is tagged. The separatergb command splits
the original image into three grayscale images, one for each color.
The tagrgb command tags all the R, G, and B images.
Once tagged, every subsequent command (shown in green) is automatically
done on all the tagged images—in this case, the three grayscale
images representing the R, G, and B components—until it hits an
untag command. The
setvalue commands are done twice: once on the real
frequencies and once on the imaginary frequencies.
The copyfft command copies the deconvoluted image back
into the image buffer so it can be displayed.
After that, the RGB images are untagged by untagrgb and
the software reverts to single image mode. It then combines the
appropriate R, G, and B files back into color images.
It's also possible to write the FFT frequencies to a text file, but be forewarned there are a lot of them.
Suppose we wanted to deconvolute a large number of images at once. Multiple images are very common in astrophotography, especially when imaging planets, when a camera similar to a webcam is used to capture many images. Instead of issuing a large number of commands you could use a macro like this:
# Any line starting with a '#' is a comment and is ignored

tagall

separatergb

untagall

tagrgb
fft(1,1,1,1)

setvalue(70,117,90,137,0)

setvalue(117,70,137,90,0)

setvalue(117,166,137,186,0)

setvalue(166,117,186,137,0)

fft(1,1,0,2)

setvalue(70,117,90,137,0)

setvalue(117,70,137,90,0)

setvalue(117,166,137,186,0)

setvalue(166,117,186,137,0)

fft(1,1,-1,1)

copyfft
combineallrgb

tagrgbcomposite

resizeimg(1920,1080)

saveall
The separatergb command creates new grayscale images named
Red0001, Grn0001, Blu0001, Red0002, etc. The software keeps track of them
and recombines them back into color with the combinergb
command after processing. This will create
the correct n/3 RGB color images from the grayscale ones. If the grayscale
ones were all 8 bit, the RGB file will be 24 bits/pixel. If they were 16
bits, the RGB file will be 48 bits/pixel.
saveall writes all the tagged images to disk without
checking whether it will overwrite anything. Select Save Image
or Close & Save image from the menus to save them one at a
time.
resizeimg converts the image back to its original size if
the size was changed by fft. In this example, the image was 1920×1080
pixels. resizeimg is different from resize in that
it doesn't delete the fft buffer.
In the Select menu, select Tag all images, then un-tag any images
you don't want to save. Then from the File menu, select "Save and overwrite
tagged images". This will save all the tagged images (such as the Red, Green,
and Blue intermediate images). It's not usually necessary to save these,
however, as the software keeps track of which R, G, and B belong to which
image. Select Tag rgb composite images to tag the final color
images for saving.
Here's a summary of all the steps you'd take to deconvolute an entire movie.
Use
ffmpegor some other program to convert each frame of the movie into a png file.Load the png files into imal.
Tag the images you want to filter.
Separate the images into R, G, and B channels (separatergb).
Untag the original images.
Tag the R, G, and B images.
Convert the images to frequency space (fft).
Filter them.
Convert them back to normal images (fft).
Combine them back into color images and save them.
Use ffmpeg to put the repaired images back into a movie file.
Although it might seem that the software ought to do all these steps automatically, it's impractical because each type of distortion requires a different sequence of steps.
To get images from a movie file using ffmpeg, you would type
ffmpeg -i test.mov -f image2 %04d.png [ . . . process the images in imal and save to disk . . .]
imal *.png
ffmpeg -i %04d.png -qscale:v 1 test2.mov
The last command would take the processed images and put them back into
a movie format, in this case Apple QuickTime.
Of course it would be too computationally expensive to deconvolute an
entire movie in software. Theoretically
it could be done, but Imal is not designed for feature films.
A maximum of 2048 images can be loaded in Imal simultaneously. However, if
images are big (over 2000×2000), it's recommended not to process more
than 100 or so images at a time unless you have a lot of memory. As an
example, the Lord of the Rings movie, which lasts 11 hr and 26 minutes,
would be equivalent to 1,234,800 frames (assuming 30 fps). On a Xeon(R)
CPU E5-1650 running at 3.20 GHz, it takes
8 seconds to process a 1920 × 1080 image. Processing the whole 11 hour
movie would take 114 days and 8 hours. As if that weren't bad enough, then
you'd have to watch that movie.
To issue a single command manually, move the cursor onto the command
in the macro / command editor (Edit | Macro/Image math) and
hit Shift-Enter. To execute an entire macro, move the cursor to somewhere
on the starting line of the macro and click Execute. It will execute
everything in the macro editor starting at that line. If any images are
"tagged," it will execute the command on every tagged image (with certain
exceptions, like changing the filename, which wouldn't make sense).
Be sure to click Save to copy the macro to disk for future use.
Note: if you do an FFT manually, you may sometimes need to click the “real FFT” or “Power Spectrum” button under Display in the FFT Dialog Box, or all you'll see is the original image or possibly solid white. This is because the program may estimate the white and black levels incorrectly. We're working on why it does that.
If you're doing FFT filtering manually, you can also select the desired region with the mouse, then type i=0 in the command editor. A common mistake is to do the real but forget the imaginary frequencies. Selecting Power Spectrum does them both.
Running many FFTs at once takes a lot of memory.
If your computer doesn't have enough memory, you can increase available
memory by disabling backups in the configure menu.
If unsure about how much free memory is available, run vmstat.
If your images are big, it's recommended to do only 10 or 20 at a time.
FFT Deconvolution
Although manual frequency filtering gives the best results, it is a lot of work. What deconvolution does is to take a second image (PSF) that supplies the unwanted frequencies automatically. The weakness of this method is that it isn't always possible to know the true PSF, so it's often necessary to experiment.
Here is the command for deconvolution:
deconvolute(image1, image2)
For example, if the blurred image is image #1 and the PSF is image #2,
you would type
deconvolute(1,2)
Of course
you can also do that in the menus. Keep in mind that convolution and
deconvolution only work for grayscale images, so you may need to separate
the R, G, and B first.
Here are some example commands for FFT. You would type these in the Macro/Image Math box.
| Command | Function |
|---|---|
| fft(4,1,1,1) | Forward FFT of image #4, show real freq |
| fft(4) | Forward FFT of image #4, accept defaults |
| fft(4,1,0,2) | Change display to show imaginary freq |
| fft(4,1,0,3) | Change display to show power spectrum |
| fft(4,1,-1,1) | Reverse FFT, show real freq |
| fft(4,1,0,0) | Change display to original image |
Note that param 1 is ignored if there are tagged images. In this case, it will do a Fourier transform on all tagged images.
When you deconvolute with FFT, both images have to be the same size and pixel depth. Just as important, the relevant point spread function (image#2) must be perfectly centered. Otherwise the deconvoluted image will be shifted vertically or horizontally. The usual procedure for FFT sharpening is to make a copy of your image, set it to black, then create a white dot in the center and low-pass filter it.
Low-pass filtering can also be done by changing the frequencies in the very center of the FFT, but this can be tricky to get right.
Richardson-Lucy Deconvolution
Richardson-Lucy deconvolution gives results that are about halfway between FFT deconvolution and ordinary image sharpening (which is itself a form of convolution) in quality. R-L is an iterative algorithm, so it's necessary to experiment to find the optimal number of iterations. If you select too many, the image gets sharpening artifacts. The middle image in Fig. 4 used four iterations and artifacts are clearly visible in the result. Any manipulation of an image, including deconvolution or filtering, needs to be documented in publication. Over-deconvolution artifacts from R-L are common and easy to spot.
As shown in Fig. 4, the best result was obtained by Fourier filtering. This was mainly due to the difficulty in finding a PSF kernel to represent an aliasing PSF. The artifacts around the edge in the R-L deconvolution are commonly seen, but are not a fatal problem because they can be eliminated by adding a buffer region around the image.
You can perform R-L deconvolution on multiple images by clicking on
Select – Tag all images, then untag the PSF by clicking on
Select – Select image. In the list, select the PSF and
click Untag. The 'T' should disappear from the list. Then select Deconvolution
from the Measure menu, set the PSF image number, and click Accept.
The advantage of Richardson-Lucy deconvolution in Imal is that the RGB separation and recombination are done automatically, so you don't have to keep track of the intermediate red, green, and blue image files. The weakness of both R-L and FFT deconvolution is the difficulty in finding the optimal PSF image. In critical cases, like the deconvolution that was used for the Hubble Space Telescope, NASA used optical equations to calculate the optimal PSF. The best method to use depends on the specific noise that is to be removed from the image. But as in all science, the goal is to get results that are good enough that you don't have to process them at all.
Command reference for FFT-related functions
Most of these commands can also be done from the menus. Most menu items can be used as commands by typing them in the Command Editor without spaces. See manual for other commands.
| Command | Example | Parameters | Function |
|---|---|---|---|
| fft(source,psf,direction,display) | fft(1,1,1,1) fft(1) | source = image to convert psf = image for PSF direction 0=none, 1=forward, −1=reverse display 0=original, 1=real, 2=imag, 3=power | 2D FFT of an image |
| convolute(image1, image2) | convolute(1,2) | convolutes two images | Puts result in image #1 |
| deconvolute(image1, image2) | deconvolute(1,2) | image1 = destination, image2 = psf | FFT deconvolution |
| select(x1,y1,x2,y2) | select(40,40,60,60) | coordinates on image | Selects a rectangular region |
| setvalue(x1,y1,x2,y2,value) | setvalue(40,40,60,60,0) | Sets all pixels in the region to 'value.' If real, imaginary, or power of fft is displayed it sets the appropriate FFT values | Sets values in rectangular region |
| tag(image number) | tag(6) | Commands are applied to all tagged images | Tags an image |
| untag | untag(6) | Untags image #6 | Untag an image |
| tagall | tagall | Tag all images | |
| untagall | untagall | Untag all images | |
| tagrgb | tagrgb | Tag all R,G, and B images | |
| untagrgb | untagrgb | Untag all R,G, and B images | |
| copyfft | copyfft | An FFT must be done first | Copies displayed fft into image |
| separatergb | separatergb | Creates 3 new images | Splits R,G, and B channels of a color image |
| combinergb | combinergb(2,3,4) | R, G, and B images must be 8 or 16 bit grayscale | Creates a 24 or 48-bit color image |
| combineallrgb | combineallrgb | Untags all images and combines images based on filename (eg Red006, Green006, Blue006 will be combined into rgb006) | Creates n/3 24 or 48-bit color images |
| open | open(gray.tif) | Reads an image from disk | No wildcards |
| close | close(6) | Closes image no. 6 | Note, higher image numbers drop down |
| i, r, g, b, x, y | i=4*x*y r=(b+g)/2 | Image math left hand side | Use r,g,b for color and i for grayscale |
| image, red, green, blue | r=green[1][0][x][y] | Image math right hand side | Doesn't work on fft real or imaginary |
sep 06 2023, 4:24 am
Related Articles
Tutorial on image forensic testing in imal
How to analyze scientific images to detect image manipulation
in the free open-source Imal software package
Building and using a high-quality Western blot imaging system
You can build an imaging system for the lab for 1/8 the cost, and
get better results by understanding how they work
How to do bad image forensic analysis
Scientific journals are paying experts to analyze images submitted
by researchers. They're not very good
