 hese days, when hundreds of thousands of humans are running around infecting some
poor innocent virus, it's worth remembering that epidemiologists cannot predict
the size of an epidemic.

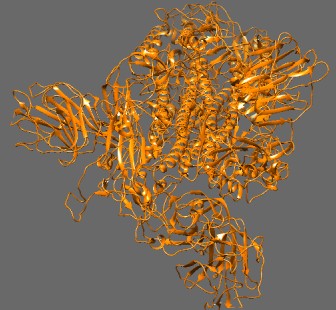
Cryo-EM structure of ACE2 bound to SARS-CoV (Song et al. [10]). Trypsin-cleaved and low pH-treated SARS-CoV spike glycoprotein and ACE2 complex, ACE2-free conformation with three RBD [receptor-binding domains] in down conformation. Rendered in Chimera.
In the words of Duncan J. Watts:[1]
Whenever a major outbreak of a novel infectious disease occurs, as happened most recently in 2003 with SARS, public health officials are invariably confronted with the question: how big will it be? As reasonable a question as this would seem, mathematical epidemiology currently provides no answer.
Perhaps this fact contributes to some of the fear we're seeing in the public, which is buying vast amounts of toilet paper, and the abject hysteria on some websites. One commentator wrote: “As the son of a hardcore Fox watcher in her seventies, I want to thank the Murdochs for telling the network's hosts to quit being virus denialists.”
SARS-CoV-2 preferentially infects patients who are being treated for hypertension, diabetes, and coronary heart disease. 99% of the patients in Italy who died had one or more of these three conditions. The standard treatments for these diseases all have the side effect of inducing angiotensin-converting enzyme 2 (ACE2), which is the receptor for the virus.
This is strong circumstantial evidence that the epidemic of fatalities was caused by an unrecognized adverse effect of drugs that affect the renin-angiotensin system. This would explain why different countries have different fatality rates: they're using different ways of treating hypertension.The US government should direct the FDA to investigate this possibility and, if necessary, issue an emergency recall of these drugs. The EMA in Europe and the China Food and Drug Administration, which is the FDA's equivalent in China, should do the same.
The interaction between ACE2 and SARS viruses is a classic drug hypersensitivity response and it has been known about for at least two years. If the COVID-19 deaths and the worldwide chaos are really due to a drug-induced virus hypersensitivity reaction, we may be looking at the worst international drug regulatory failure in history.
The urge to strike out with hate and fear may be, in some ways, understandable. Some scientists are claiming that as many as 60% of the population will contract COVID-19 caused by the Wuhan coronavirus SARS-CoV-2, which means that millions of people are going to die.
But expressing skepticism about such claims is not denialism. Nor is skepticism about the idea that we must all isolate, stop working and traveling, and allow our economy to crash in the belief that China's strategy, whatever it was—and I am starting to become skeptical about it—was the best way to handle the Wuhan flu.
A new paper came across my desk yesterday describing an epidemiologic model of the Wuhan coronavirus. The authors assumed an R0 of 2.4 and that 50% of patients in critical care will die. They also assumed an infection fatality rate (IFR) of 0.9%. They then considered the outcomes of various scenarios ranging from case isolation, where symptomatic cases stay at home for 7 days, home quarantine of persons over 70, and closure of 75% of all schools.
They concluded that in the absence of any control measures, 81% of the population will get infected. Accordingly they predicted 510,000 deaths in the UK and 2.2 million deaths in the USA. They claimed that closing the schools + case isolation + home quarantine + social distancing, if maintained until a vaccine is available (which will take at least a year), would reduce the UK deaths from 510,000 to 8,700.
The problem with these and other simulations is not their calculations, though a R0 of 2.4 is probably too high, but in the idea that herd immunity is a population-scale phenomenon. Herd immunity is certainly real, but it's an oversimplification. The concept is simple to understand, which is why officials use it as a way of convincing the public to get vaccinated.
Of course humans are not a herd, but a collection of groups of individuals who may or may not interact with each other.
The traditional parameter everyone knows about is R0, the number of new
cases one infected individual will generate on average. The critical proportion of
the population that must be immune to prevent spreading (i.e. keep R0
below 1) is given by the simple formula

If a virus has an R0 of 2, it means that if 50% of the people are immune
the disease will not spread. If it's 4, then 75% of the population must be immune.

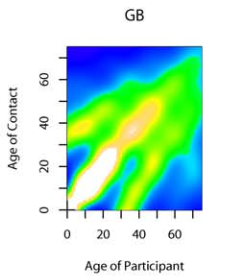
Contacts between people of different ages (from Mossong et al [2])
CJE Metcalf et al.[3] point out some of the assumptions in this simple model:
- Heterogeneous mixing
- Time-independent mixing
- Homogeneous immunity
These assumptions are rarely met in the real world. Scientists have discovered—sit down before you read this—that people mix mostly with persons of their own age and social status, and persons between 5 and 19 are most at risk for getting communicable diseases.[2] People 10–14 have 18.22 ± 12.27 (x±SD) contacts, while people >70 only have 6.89 ± 5.83 contacts. Even birth rates affect the impact of vaccination on age distribution.[4]
From the image above, this means that a 70-year-old lives in a world with a much lower population density than a 20-year-old, and has almost no access to people in the age bracket where they need to be told to get off his or her lawn. What it also means is that the rate of infection will vary considerably according to age. The standard equation doesn't take this into account, but it's important.
Compartment models
Some models have tried to take these factors into account, for instance by creating a four-compartment model (susceptible, exposed, infected, recovered). Transitions between compartments occur with different rate constants, and the number of patients in each compartment can be easily calculated using differential equations, provided the rate constants are known. These models require knowledge about how people interact.
The compartment models show that contact heterogeneity does not influence endemic equilibrium (the size of the epidemic), but dramatically changes its dynamics. Because only a small proportion of susceptible individuals come into contact with infectious individuals, the rate of infection increases more slowly and persists longer than simple models would predict.
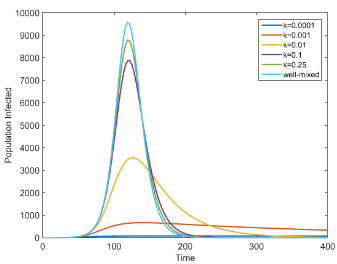
For example, Kong's model[5] gives us a new parameter k for the
mixing rate, where k=1 is the standard homogeneous assumption. We also get a new
definition for R0:

where γ is the rate at which infected individuals recover (1/5 days),
μ is the normal birth and death rate (1/70 years),
β is transmission rate (0.5), and
α is the rate at which exposed individuals get infected (1/7 days).
Note that R0 doesn't depend on k.

Effect of people-mixing rates on time course of an epidemic (from Kong et al. [5])
The graph at right shows the effect: as people-mixing rates decrease, the height of the curve decreases dramatically. If this graph looks familiar, it's because the CDC released a similar graph to scare us into self-isolating. But it turns out that population heterogeneity, which exists already, has the same effect.
Network models
Network models are another approach. They take into account the actual pattern of interactions associated with a specific population and mechanism of disease transmission (for instance, with STDs). These network models suffer, perhaps, from the problem of proposing a proliferation of population probability parameters, also known as the “plethora of P's” problem, but are proving to be pretty popular.
Using a compromise between networks and compartments, Watts et al.[1] proposed a metapopulation model, which assumes random mixing within ‘patches’ of people and different rates between patches. This lends itself naturally to a hierarchical model of patches of patches. They discovered something very important: when an epidemic occurs R0 may have little connection to its final size.
There are even more complicated models out there. One divides the entire US population into groups of 200 people and requires hours on a supercomputer to run.
The immune system
It seems that nature has already figured this stuff out. When you get sick, your behavior changes: you automatically stop hanging out in bars and running around playing football. You might even stop going to work and spend your day in the basement working on your science blog. It also means that immunity tends to stay concentrated in space, as if there were a barrier around the infected areas, because the infected people automatically self-isolate.
We think of immunity as something that always increases after exposure. But sometimes infection can take away your immunity. Measles infection can deplete immune memory toward other pathogens. Dengue fever infection produces a weird phenomenon called antibody-dependent enhancement, where antibodies against DEN-1 strain actually facilitate the replication of DEN-2, which is a more severe strain.[7] This happens when the pathogen doesn't have a receptor to bind to, so it binds to antibodies that are attached to the surface of certain immune cells (which attach antibodies on their surface by their Fc receptor), and thereby gain entry to the cell.
One detail about viral strains: a pathogen that produces a strong immune response organizes pathogen populations into discrete strains. In other words, it is the victims that create the different strains; viruses have no say in the matter.[6]
N. M. Ferguson, a well known epidemiologist, writes
Complexities in natural host-infectious disease systems, such as the discrete structure of real populations, spatial structure, and chance effects (=stochasticity), may effect the long-period cycles or large amplitude chaos. . . . Epidemic cycles can be seen to reduce the probability of disease persistence, or, equivalently, increase the critical community size required for the disease to persist.[7]
This is all true, but what none of these models discuss is the phenomenon of immunity without infection. Can the number of virus particles be too small to cause infection yet big enough to induce immunity?
Yes they can. Disease is not all or nothing. In some tropical areas, polio is a common infection but rare as a clinical disease. The residents have acquired immunity due to repeated non-clinical exposure, while visitors from areas where polio is eradicated often contract serious clinical forms of the disease because of their lack of antibodies.
This means that as the curve in the graph above becomes flatter, the area will not stay the same, but decrease because some people will become immune without contracting a noticeable infection. It also means that it's more likely that the virus will virtually disappear after the first wave of the epidemic is over. Those models that predict recurring waves of infection are unrealistic.
A group of researchers at Stanford University School of Medicine found that memory CD45RO+ CD4+ T cells can even acquire immunity to microbes they have never encountered.[8] This happens because many pathogens share similar immunoreactive motifs. For example, H1N1 influenza can stimulate T cells to attack certain bacteria. This is also why children should not be vaccinated against diphtheria-tetanus-pertussis (DTP) vaccine at the same time as measles vaccine.[9]
The authors speculate that this phenomenon may be why kids like to eat dirt: children may be programmed to eat weird stuff to build up their immune systems.
All these factors mean that diseases often spread more slowly than predicted. Simulations that don't take these factors into account would produce overly dismal predictions, and risk spreading the nasty ‘virus denier’ meme throughout the susceptible population.
By all means, run simulations and take precautions. Just keep in mind that simulations are only as good as the parameters that go into them. Skepticism should be made welcome too. Please, let's not start this “science is settled” and “DENIER!!!” stuff again.
[1]. Watts DJ, Muhamad R, Medina DC, Dodds PS. (2005). Multiscale, resurgent epidemics in a hierarchical metapopulation model. Proc Natl Acad Sci U S A. 102(32), 11157–11162. PMID: 16055564 PMCID: PMC1183543 DOI: 10.1073/pnas.0501226102
[2]. Mossong J, Hens N, Jit M, Beutels P, Auranen K, Mikolajczyk R, Massari M, Salmaso S, Tomba GS, Wallinga J, Heijne J, Sadkowska-Todys M, Rosinska M, Edmunds WJ (2008). Social contacts and mixing patterns relevant to the spread of infectious diseases. PLoS Med. 5(3), e74. doi: 10.1371/journal.pmed.0050074. PMID: 18366252 PMCID: PMC2270306
[3]. Metcalf CJE, Ferrari M, Graham AL, Grenfell BT. (2015). Understanding Herd Immunity. Trends Immunol. 36(12),753–755. doi: 10.1016/j.it.2015.10.004. PMID: 26683689 DOI: 10.1016/j.it.2015.10.004
[4]. Ferrari MJ, Grenfell BT, Strebel PM. (2013). Think globally, act locally: the role of local demographics and vaccination coverage in the dynamic response of measles infection to control. Philos Trans R Soc Lond B Biol Sci. 368(1623), 20120141. doi: 10.1098/rstb.2012.0141. PMID: 23798689
[5]. Kong L, Wang J, Han W, Cao Z. (2016). Modeling Heterogeneity in Direct Infectious Disease Transmission in a Compartmental Model. Int J Environ Res Public Health. 13(3), E253. doi: 10.3390/ijerph13030253. Link
[6]. Gupta S, Maiden MC, Feavers IM, Nee S, May RM, Anderson RM (1996). The maintenance of strain structure in populations of recombining infectious agents. Nat Med. 2(4), 437–442. PMID: 8597954
[7]. Ferguson N, Anderson R, Gupta S. (1999). The effect of antibody-dependent enhancement on the transmission dynamics and persistence of multiple-strain pathogens. Proc Natl Acad Sci U S A. 96(2),790–794. PMID: 9892712
[8]. Su LF, Kidd BA, Han A, Kotzin JJ, Davis MM. (2013). Virus-specific CD4(+) memory-phenotype T cells are abundant in unexposed adults. Immunity 38(2):373–383. doi: 10.1016/j.immuni.2012.10.021. PMID: 23395677 PMCID: PMC3626102 Non-technical article
[9]. Clipet-Jensen C, Andersen A, Jensen AKG, Aaby P, Zaman K. (2020). Out-of-sequence vaccinations with measles vaccine and diphtheria-tetanus-pertussis vaccine. A re-analysis of demographic surveillance data from rural Bangladesh. Clin Infect Dis. ciaa291. doi: 10.1093/cid/ciaa291. PMID: 32185375 DOI: 10.1093/cid/ciaa291
[10]. Song, W., Gui, M., Wang, X., Xiang, Y. (2018) Trypsin-cleaved and low pH-treated SARS-CoV spike glycoprotein and ACE2 complex, ACE2-free conformation with three RBD in down conformation PLoS Pathog 14 e1007236-e1007236 Link
mar 19 2020, 11:36 am. updated mar 20 2020, 4:13 am. last edited mar 22 2020, 7:12 am
