Atmospheric Chemistry Notes
Rethinking Ozone
 any years ago, I did an experiment with ozone. I dissolved some cholesterol
in a solvent, put it in a test tube, and bubbled ozone through it for two
seconds. To my surprise, and contrary to what a famous chemist had written,
the cholesterol was totally destroyed. In
its place were literally hundreds of other molecules. In only two seconds
that tiny bit of ozone had ripped the cholesterol molecule to shreds and
oxidized it faster than anything I had ever seen.
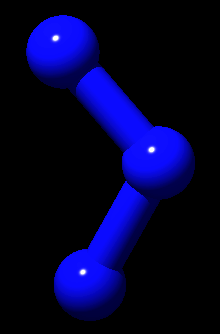 Fig. 1. Molecular model of ozone. Ozone in liquid form has a dark blue color.
The experiment was a failure, but I was left with an appreciation of the wonderful—I mean bad, terrible, bad—destructive power of ozone.
Ozone is one of the most powerful oxidizing reagents known, but it's too reactive to be an efficient toxin. It acts like a suicide bomber that blows itself up on the first molecule it comes across. It reacts almost immediately with double bonds, of which cholesterol has just one. If you inhaled it, it wouldn't get past your lungs.
For many of us, of course, ozone means the ozone layer, which means the ozone hole that we were told would end all life on the planet unless we stopped emitting chlorofluorocarbons. Dupont agreed to stop manufacturing them, and almost by magic, the ozone hole disappeared from the public consciousness—even though the ozone hole was still there, and even environmentalists agreed that if anything had changed it was far too soon to have been in response to anything we had done.
The real reason was the environmentalists had moved on to their next big project: global warming. By now most of us are bored to death about global warming, and perhaps even more so about the ozone hole. Before the ozone hole there was acid rain, and before that alar, PCBs, pesticides, and so on. All imminent disasters that magically went away.
We are now in a position, nearly thirty years after CFC production was stopped, to ask: has the Montreal Protocol actually done anything? Or were we chasing after phantoms? The ozone hole has features more consistent with natural variation than with a gradual reduction by CFCs. New data have raised even more doubts about the CFC hypothesis.
In this article I will summarize what's known about atmospheric ozone. Much of the information here is from Ozone in the Atmosphere, an excellent, and really expensive, new book by Peter Fabian and Martin Dameris [1]. Click here for a nontechnical version of this article.
Ozone in the stratosphere
The famous ozone layer is thinnest at the equator and thickest near the North Pole and around 60° south latitude. Over Antarctica it decreases in the early spring, while over the Arctic it is lowest in the late autumn. The lowest polar levels 100 Dobson units (DU) = 1 mm thickness of ozone at standard temperature and pressure (STP). are around 280 Dobson units, while year-round at the equator rarely rises above 260.
The Dobson unit is a measure of the total amount of ozone overhead in terms of how many millimeters thick it would be if it were a pure gas. It's done by pointing a special spectrophotometer at the sun or moon and measuring the ultraviolet light at a number of different wavelengths. G.M.B. Dobson was a physicist who built the first one back in the 1920s.
The largest amount of ozone is found over the North Pole (around 440
Dobson units) and the least is at the equator, which is almost always below 260.
At the equator the ozone layer is at higher altitudes, peaking at 24 km, while
at the poles it's closer to the surface: around 18 km up.
 Fig. 2. Ozone hole showing surrounding region of elevated ozone. (Redrawn from [2])
The so-called ozone hole occurs over Antarctica during September and October, which is springtime in Antarctica, not that you could really tell—but for whatever reason, the Arctic ozone is actually at its peak in springtime, in March. In the ozone hole, ozone can go as low as 150 DU. The difference between the Arctic and Antarctic is usually attributed to the fact that the stratosphere over the Antarctic is 10°C colder than over the Arctic, and so it has more polar stratospheric clouds, which only form below −78°C. These clouds contain ice crystals on which chemical reactions can occur and also can block ultraviolet rays.
Another factor is said to be the reduction in planetary wave activity in the southern hemisphere, which physically isolates the air over Antarctica [4]. In the spring, the wave scarcely penetrates the Antarctic polar vortex, so transport is lowest [6]. Surrounding the ozone hole is an area of greatly increased ozone (Fig. 2). (Point of interest: just by coincidence, −78.5° is the also the sublimation point of dry ice).
All this implies that a better term for “ozone hole” might be
“ozone slurping out of the pole and into the surrounding regions.” This,
however, takes much longer to say. There is no ozone hole over the Arctic—only
a region of greatly increased ozone.
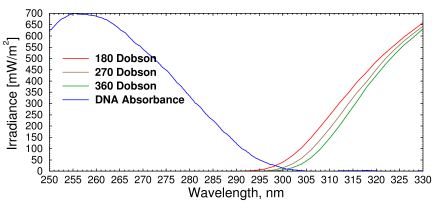 Fig. 3. Irradiance vs. wavelength for different amounts of atmospheric ozone.
DNA absorbs most strongly at 260 nm. (Redrawn from [1])
If the amount of stratospheric ozone were to decrease, the UV irradiance at ground level between 280 and 315 nanometers, known as UV-B, would increase. Other wavelengths are not affected much. The most harmful rays, UV-C (200-280), would still be completely blocked, and the rays that cause suntan, known as UV-A (315-400 nm), are hardly absorbed by ozone at all. The most dangerous wavelength for producing melanoma is 260 nm, where DNA absorbs the most, but DNA also absorbs a little bit of radiation up to about 305 nm (Fig. 3). The area where the two curves cross would increase and that is what we would worry about.
Thus the risk for sunburn is higher in the tropics, even when corrected for the amount of light, because the ozone layer is thinnest near the equator, even though there is no “hole” there.
Ozone and sunspots
The sun has a major effect on ozone because it emits ultraviolet light which creates ozone and radioactive particles which destroy it.
Ionized particles (mainly protons and relativistic electrons) from the sun produce NOx radicals in the atmosphere, so a solar storm can produce big decreases, on the order of 20%, in the amount of ozone near the poles. UV radiation at wavelengths below 242 nm produces ozone. At 175 nm, a wavelength which produces lots of ozone, the solar flux is 50% higher during a sunspot maximum than at a sunspot minimum, and the increased shortwave UV during a maximum will produce more ozone, especially at high altitudes. Because of this, the thickness of the ozone can vary by a factor of two with the 11-year sunspot cycle, with a 2-year lag because the residence time of NOx is about 2-3 years. This has been very difficult to measure due to large natural variations. Solar-induced temperature changes can also affect ozone levels.
Solar flares can also increase the amounts of HOx radicals in the stratosphere, which can chew up ozone. Big flares have been estimated to reduce ozone to 1/3 its normal level. Computer models suggested that this works by depleting free radicals and water. Although the stratosphere is extremely dry [6], water is important for controlling ozone levels because it can be split into H and OH radicals. During a flare the H radicals are converted to dihydrogen (H2), and water levels in the stratosphere decrease. After the flare is over, the lack of water would cause ozone levels to rebound, according to computer models, to 3× its normal level [7]. In principle, gamma radiation from nearby supernovas could also deplete the ozone layer by increasing NOx.
High-energy cosmic rays can also reduce ozone levels by creating chlorine radicals from CFCs [12]. Q.B. Lu, the lead author of the paper that reported this, was quoted as saying “100% of the ozone loss over Antarctica must be driven by cosmic rays,” implying that cosmic rays are much more important than UV light in destroying ozone, especially during the polar night [14] (see reactions below).
Cosmic ray flux tracks the sunspot cycle because the solar wind and the Earth's magnetosphere “modulate” the galactic cosmic ray spectrum. That is to say, when sunspots are high, fewer low-energy particles (below about 100-1000 MeV) get through, so the galactic cosmic ray spectrum is weaker but shifted to higher energies [13]. Cosmic rays can also increase stratospheric NOx radicals, and cosmic ray-induced ionization is an important source of NOx at high latitudes [15].
The discovery that cosmic rays can produce free radicals solved a puzzling feature in the theory: the models had required UV light to initiate the free radical chain (see below), but there is very little UV light in the polar winter. Free radicals are transient species that would not hang around very long after being produced. Yet the Montreal Protocol went forward assuming that ozone was being depleted mainly by photolysis of Cl2 to Cl, which occurs during the spring.
Ozone causes blondes and acid rain
According to Lefohn [9], as much as 50 parts per billion (ppb) of the ozone found in the troposphere comes down to us from the ozone layer like manna from heaven by a process called stratospheric-tropospheric transport [8]. This natural ozone reacts with water to form hydroxyl radicals (OH.) that react with methane, hydrogen (H2), methyl chloride gas, and really, just about everything else. It is responsible for oxidation of sulfur dioxide (SO2) and nitrogen dioxide (NO2) to sulfuric and nitric acid. So, without that wonderful ozone layer there would be less acid rain.
OH radicals made by ozone also convert methane gas into formaldehyde and ultimately to carbon monoxide, CO, which is gradually oxidized further by reacting with another hydroxyl radical to form CO2. This reaction is: CO + OH → CO2 + H. The H (atomic hydrogen, not H2 or H+) that's produced reacts with oxygen to form hydrogen peroxide (H2O2), a strong oxidizer found in clouds and in hair lightening products.
Ozone is also believed to be partly responsible for the high temperature of the stratosphere, because it absorbs so much ultraviolet light. The atmosphere's temperature decreases to −55°C at 10 km, then increases to 0°C by 50 km. By comparison, Mount Everest is 8.85 km high. If Everest were just 6000 feet higher, it would be warmer at the top than it is now.
Ozone creation and destruction
Ozone is formed when molecular oxygen absorbs ultraviolet light with a wavelength shorter than about 242 nanometers. In the table below, hν is ultraviolet light and M is any air molecule, which in some reactions acts as a catalyst. Because the non-UV reactions are much slower, the rate of ozone production depends primarily on the amount of UV and oxygen (O2). UV light can also destroy ozone.
| O2 + hν → 2O | v.fast | UV splits oxygen to make atomic oxygen |
| O + O2 → O3 | fast | Atomic oxygen reacts with molecular oxygen to make ozone |
| O3 + hν → O + O2 | fast | UV light decomposes ozone |
| O + O3 → 2O2 | slow | Atomic oxygen can also decompose ozone |
| O + O + M → O2 + M | slow | Atomic oxygen can combine to molecular oxygen |
Even though not all of these reactions produce ozone directly, they work together cyclically to produce ozone, so they're grouped together. For example, atomic oxygen produced by the first reaction reacts with dioxygen to produce ozone.
Ozone can be destroyed by other molecules, primarily oxygen, nitrous oxide radicals, and water radicals formed by photolysis, as in the following sequence of reactions:
| O3 + hν → O* + O2 | fast | UV splits ozone, making excited oxygen |
| O* + H2O → 2OH | slow | Excited oxygen reacts with water to make hydroxyl radical |
| OH + O3 → HO2 + O2 | slow | Hydroxyl radical chews up ozone |
| HO2 + O3 → OH + 2O2 | slow | HO2 chews up ozone, making more hydroxyl |
| O + O3 → 2O2 | slow | Atomic oxygen also chews up ozone |
Nitric oxide (NO) also reacts with ozone, and when ozone is present NO can destroy O, slowing down ozone formation, as shown here:
| NO + O3 → NO2 + O2 | slow | Nitric oxide reacts with ozone |
| O2 + hν → 2O | fast | UV causes oxygen to dissociate |
| NO2 + O → NO + O2 | slow | The atomic oxygen then reacts with nitrogen dioxide |
The net result of the above sequence is that nitric oxide catalytically breaks down ozone.
These are all free radical reactions. But, like all the bimolecular reactions (reactions that have two starting materials), they are relatively slow, because it takes time for two different molecules to find each other. For a bimolecular reaction, the rate is proportional to the product of the concentration of the reactants. In the stratosphere, the air pressure is 100 times thinner than at the surface, and these molecules are present in parts per trillion concentrations. This means the reaction rate would be many millions of times slower than the light-catalyzed reactions. In fact, O (atomic oxygen) is so rare it is practically nonexistent below 25 km [1].
Chlorofluorocarbons
Chlorofluorocarbons (CFCs) are present in ppb concentrations, but only a small proportion of these molecules are present as radicals. So the reaction is also extremely slow. Luckily, the temperature inversion at the tropopause acts as a barrier that greatly slows the rate at which molecules from the surface can enter [5]. But the jet stream causes slow mixing, and violent phenomena such as nuclear explosions and volcanic eruptions can inject contaminants into the stratosphere.
Stratospheric clouds can increase the rate of reaction by providing a surface that brings molecules together. This occurs mainly for polar molecules like HCl and ClONO, which are soluble in water or react with it. For example, ClONO reacts with water to form nitric acid (HNO3) and HOCl.
Ultraviolet light releases chlorine radicals from CFCs by a process called photolysis. Ultraviolet light can also photolyze chlorine (Cl2), HOCl, and ClONO, liberating chlorine radicals which destroy ozone. Notice how reactions can combine, regenerating all or most of the starting materials except for ozone. This is a catalytic cycle. Without the catalytic effect, these molecules would just be destroyed when they react. Molina and Rowland [10] first described how chlorofluoromethanes, known as Freons (mainly CF2Cl2 and CFCl3), could catalytically destroy ozone. These two molecules are photolyzed by ultraviolet light between 175 and 220 nm, liberating chlorine radicals. Some of the reactions believed today to be important are shown in the table below.
| Cl2CF2, Cl2, etc + hν → Cl + other stuff | Light kick-starts the reaction by breaking off a Cl |
| Cl + O3 → ClO + O2 | Cl reacts with ozone creating ClO |
| ClO + O → Cl + O2 | ClO chews up oxygen radicals, regenerating Cl |
| ClO + ClO → (ClO)2 | ClO can dimerize, catalyzed by an air molecule |
| (ClO)2 + hν → Cl + ClO2 | More UV light regenerates Cl from the dimer |
| ClO2 → Cl + O2 | Cl is also regenerated by decomposition of chlorine dioxide, or can be made in dark, catalyzed by an air molecule |
Brominated and fluorinated compounds work in generally the same way as chlorinated compounds, but at different rates because the C-F, C-Cl, and C-Br bonds have different stability, which affects the ability of different molecules to survive long enough to reach the stratosphere. Thus brominated compounds are potentially more destructive than chlorinated compounds, but there is less of them in the stratosphere. About 60% of the methyl bromide, which is the most important one, is said to come from natural sources.
CFCs and Ozone
The ozone hole is a recent discovery. The first clue was a 1982 poster by Shigero Chubachi showing a decrease from 300 to 200 DU. In 1985 a Nature paper by Fairman et al. [6] described the phenomenon that came to be described as a “hole.” As measured at five different stations, the only clear trend since then was a slight drop in 1992-1994, which has been attributed to Mount Pinatubo. So far, there is as yet no clear sign that ozone has started to increase.
Stratospheric ozone between 35-45 km has basically remained roughly constant since about 1985, which is two years before the Montreal Protocol was adopted (see graph below). The lack of continuing decline is puzzling, because the mean surface mixing ratios of most CFCs have decreased only slightly, if at all, between 1990 and 2010. Some have increased dramatically. Some articles show a graph that seems to be bending up slightly in recent years, but the error bars are large. To the skeptical eye it looks like wishful thinking. We would like to believe we fixed the problem. But if ozone starts declining again, there will be many red faces.
| Molecule | Lifetime | Direction | 1990 ppt | 2010 ppt (parts per trillion) |
|---|---|---|---|---|
| CFC-11 | 45 yr | ↓ | 267 | 240 |
| CFC-12 | 100 yr | ↑ | 480 | 540 |
| HCFC-22 | 12 yr | ↑ | 90 | 190 |
| Methyl chloroform | 5 yr | ↓ | 130 | 10 |
| Methyl bromide | 0.7 yr | ↓ | 9 | 7.8 |
Some molecules, like chloroform, methyl bromide and methyl iodide, don't last long enough to make it up to the stratosphere before being destroyed or washed out. So they probably never contributed much to ozone depletion. They might make it up there in localized areas, but there is still a lot of uncertainty about that.
Evidence
There is spectroscopic evidence that these reactions occur in the stratosphere. The free radicals are too unstable to detect, but COF2 and COFCl, which are products of the reaction with oxygen, have been detected. Stratospheric levels of HF, one product of CFC photolysis, increased by 3 to 4-fold between 1978 and 1989 [11]. Computer models of reaction kinetics, which are based on laboratory measurements, predict ozone loss. Other, more complex computer models are needed to predict the rate of stratospheric transport. There is also clear evidence that ozone was decreasing until about 1985. Chemical kinetics equations are very robust, even for free radical reactions, provided that you know all the side reactions and all the rate constants precisely. Unfortunately, this was recently found not to be the case. And, of course, you can't model a reaction you don't know about. Even one such reaction could easily invalidate their model.
The main thing that ties CFCs to the ozone hole is the computer models. As I will show below, these models cannot account for the shape of the change, and they did not predict the Arctic ozone hole or its disappearance.
Precautionary Principle The Precautionary Principle states: “We don't know if this is what causes the problem, or whether the problem is even real, but we can't take any chances, so we'll ban it.”Banning CFCs was an example of the so-called precautionary principle, and in this case the economic interests of Dupont coincided with the interests of the environmentalists, so there was no serious opposition. It's generally regarded as a success story. But the subject is highly politicized, and much of the information on the subject, especially on the Internet, is based on politics instead of cautious science. To your refrigerator repairman, the whole episode probably smells like Danegeld.
Historical Data
Let's look at the historical data (Fig. 4). The ozone hole is the bottom of those sharp downward-pointing peaks that occur at one-year intervals. Rather than a gradual change as you might expect, these peaks suddenly jump from about 220 to around 120 beginning around 1985. This remains constant almost to the present. This sudden jump is a striking example of non-linearity and it is hard to explain by the gradual increase of an environmental pollutant. There is no doubt that CFCs can react with, and (at least in computer simulations) deplete ozone. But the amazing non-linear effect shown here cannot be easily explained by a chemical reaction. If you attribute it to a multi-substrate reaction, we could imagine that the dependence on CFCs would follow a power curve, but there would not be a plateau like we see here. Same for a threshold effect.
Computer models can explain some of this. But as a friend of mine once said, with a computer model you can fit your aunt to your ankle. To me this curve is a clear example of a state transition in an attractor. An attractor is a mathematical function that describes how natural phenomena can remain stable for a long time, and then suddenly jump to a completely different state, remain there for a while, and then jump back, seemingly at random. Chris Lucas has a good description of attractors.
Whatever is causing this pattern, whether it's an attractor or a hitherto unknown chemical reaction, there's a big piece of the puzzle missing, and many Nature papers waiting to be written.
Note that this graph is plotted from ground-based Dobson data, not the NASA NIMBUS-7 satellite data which, embarrassingly, had been corrupted by a computer program that automatically threw out any data point below a certain value. NASA scrambled to add the missing data points to their data set after their mistake was discovered.
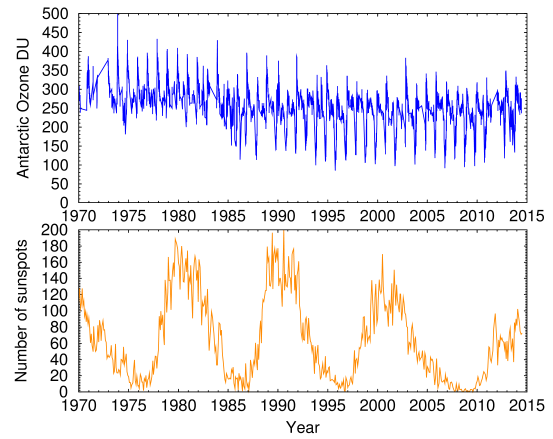
Fig. 4. Top curve: Antarctic ozone historical data 1970-2014 (Data Source: NOAA)
Bottom curve: International Sunspot Numbers.
The sunspot cycle is plotted in the lower curve. With a little imagination it's possible to see the influence of sunspots, but a statistical analysis is really necessary to see it. The sunspot data are from NASA's compilation of the International Sunspot Numbers created by the Solar Influences Data Analysis Center in Belgium.
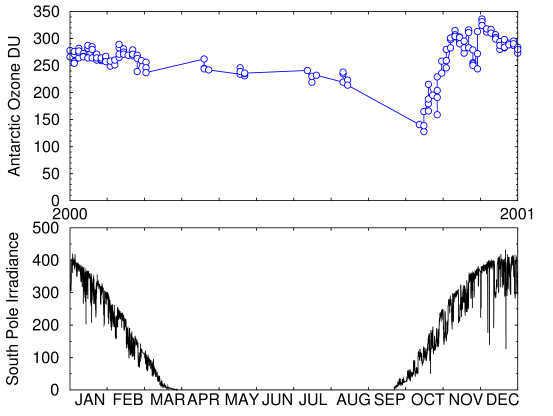
Fig. 5. Top curve: Antarctic ozone historical data for 2000 (Data Source: NOAA)
Bottom curve: Average daily insolation at South Pole in 2000 from NOAA's ESRL Global Monitoring Division. (Data Source: NOAA)
This graph (Fig. 5) shows how the measured ozone level changes over the course of one year. Ozone decreases at roughly the same time, or possibly slightly before, the sunlight begins to return in the southern spring. Unfortunately, few measurements have been taken in August and almost none in September. Those missing data points contain critical information that we would need to be confident about whether the ozone starts to decrease before or after the light returns.
The reason that's important is that ozone is not produced during the polar winter, because formation of ozone requires UV light. But the ozone does not begin to drop until winter is almost over. The reason for this is said to be that the reactions are free-radical reactions. Free-radical reactions don't start spontaneously. They need an initiator which kick-starts the reaction chain. The models indicated that UV light is not only necessary to create ozone, but also to destroy it. The thinking was that chlorine, produced during the previous year, accumulates in polar stratospheric clouds during the winter, and then starts chewing up ozone when light hits it in the springtime.
Arctic ozone hole
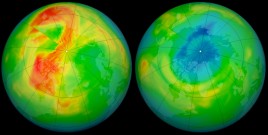 Fig. 6. Ozone hole over North Pole in 2011 (Source: NASA/Goddard).
In 2011 the ozone over the Arctic decreased by 50-100 DU to 320-349 DU (Fig. 6). The ozone levels were the lowest over the Arctic ever recorded—24 years after Montreal. This was about half as much as the loss in the Antarctic, but it was unexpected. It also happened while the hole over Antarctica was commonly and erroneously believed to be getting smaller. NASA fired up their computer models and attributed the hole partly to CFCs and partly to a natural delay of final spring warming, which reduced transport into the polar vortex [16]. The Arctic hole has since disappeared (after lots of hand-wringing in the popular press). But here's the point: if an eddy can happen for one year, it can also happen for ten years. And that means we have to rely on models to tell us how much of the hole over Antarctica is caused by CFCs and how much is natural. Which is a polite way of saying that all we really have is a hypothesis. In other words, we really do not know whether the hole is caused by CFCs, natural variation, or something else that we have not yet discovered.
Conclusion
Has the Montreal Protocol prevented the ozone hole from worsening, or is it just a convenient fiction? It's too early to say. Unfortunately, it has also become something of a sacred cow. The idea that manmade chemicals have affected the ozone layer is in some ways a metaphor for the fact that politics has contaminated the way science is done and perceived. We can no longer think about ozone without realizing how politics has distorted our opinions of it. It's a shame that we put so much focus on the dangers of chemicals instead of on their fascinating properties, because the greatest discoveries are always made not when the research is channeled into public service, but when a natural phenomenon is studied for its own sake.
It also hurts innovation, because we feel compelled to fit everything into the reigning paradigm. Mainly this is because of the human need to believe that we really do understand the problem. Psychologists call this cognitive closure, and it's always a risk in science, but the pressure to reinforce a public narrative can only raise that risk. A perfect example was the quote from a NASA scientist saying the Arctic ozone hole wouldn't have been as severe if it happened thirty years from now, because there will be less chlorine in the atmosphere. I hope she's right, but I wouldn't be surprised if she's not. A big piece of the puzzle is still missing.
References
[1] Ozone in the atmosphere: basic principles, natural and human impacts. Fabian
and Dameris, 2014, Springer.
[2] Dameris M Loyola D, Atmospheric physics, background, methods, trends. Springer, 2012.
[3] World Meteorological Organization, Report No. 52, 2010, cited in [1].
[4] Peixoto and Oort, Physics of Climate, Springer 1992.
[5] Kallenrode, Space Physics, Springer 2010.
[6] Farman JC, Gardiner BG, Shanklin JD. Nature 315,207, 1985.
[7] Crutzen PJ, Solomon S, Planet Space Sci 28, 1147, 1980.
[8] Lefohn AS, Wernli H, Shadwick D, Oltmans SJ, Shapiro M, Atmospheric Environment
62, 646, 2012.
[9] Lefohn AS, Wernli H, Shadwick D, Limbach S, Oltmans SJ, Shapiro M,
Atmospheric Environment 45, 4845, 2011.
[10] Molina MJ Rowland FS, Nature 249, 810, 1974.
[11] R. Zander, M.R. Gunson, J.C. Foster, C.P. Rinsland, and J. Namkung,
J. Geophys. Res. 95, 20519, 1990.
[12] Lu QB, Sanche L, Phys Rev Let 87, 078501, 2001.
[13] Kallenrode MB, Space Physics 3rd ed, Springer 2010, p. 267.
[14] Lu QB, Phys Rev Lett 102 118501, 2009.
[15] Calisto M Usokin I Rozanov E Peter T, Atmos Chem Phys 11, 4547, 2011.
[16] Strahan SE Douglass AR Newman PA J Geophys Res Atmospheres 118, 1563, 2013.
