IMAL - Summary of features
This is a partial list of image analysis features in imal.
For a complete list, see the
manual.
2D Gel Analysis
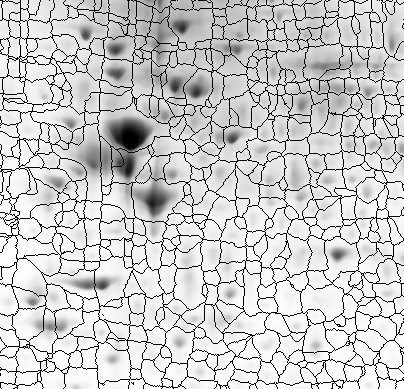
Imal can identify and perform densitometric measurement of spots in
two-dimensional gels with a single click. The automatic background
detection feature calculates the background value around each spot
with sub-pixel-value accuracy that far exceeds the integer background
used by other software packages.
Strip Densitometry
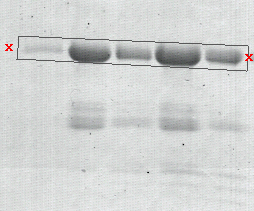
A typical application of densitometry is measurement of band densities
on Western blots or protein/DNA gels. The image above is a
polyacrylamide gel stained with Coomassie blue. In order to measure
the amount of protein in this gel, we click on "strip densitometry"
and select two endpoints (shown with 'x') on either side of the gel.
The program will measure a rectangular region and plot the results
in a graph like the one shown below.
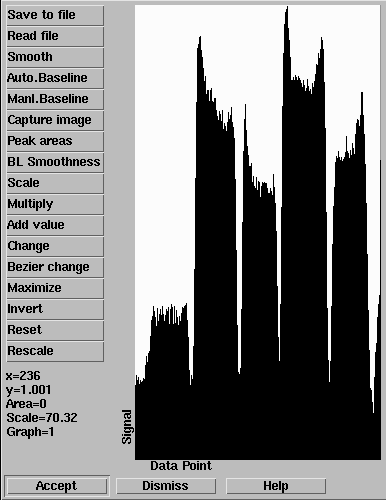
In this graph, each of the five peaks represents the cross-sectional
area of the corresponding band in the gel. The area of each spot can
be measured by dragging on the peak using the mouse. The measured band
intensities are automatically placed in a list box which can be saved
into a text file.
Spot densitometry
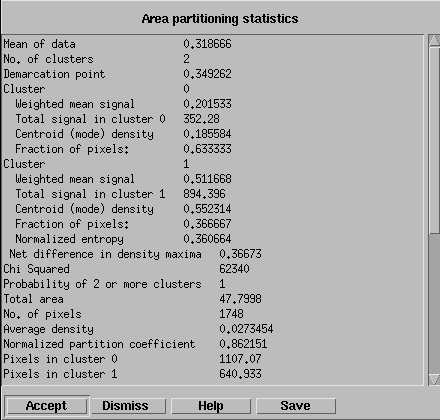
Alternatively, the bands can be measured individually, using "spot densitometry".
A common problem in such measurements is the difficulty in determining
the correct background value. Choosing an incorrect background can produce
enormous errors in the results. imal uses a fuzzy k-means algorithm
(above) to calculate the signal and background values automatically with
sub-pixel-value accuracy. This can give up to a 100-fold increase in accuracy
in densitometric measurements.
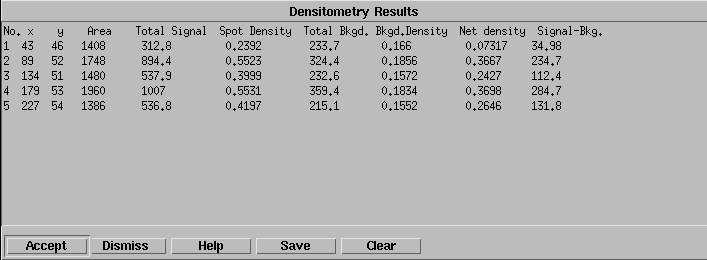
As with strip densitometry, the results of each measurement are
immediately added to a list box as shown here.
Filtering
In scientific and technical images, filtering is not used to make the
image pretty but rather to retrieve data that would otherwise be lost.
The silver-stained 2D gel shown below (left) contains several important spots
that are obscured by a dark overstained area. Filtering the original image
(A) with several common convolution filters used by other programs
failed to restore the true spot and background intensities (B-F).
However, imal has a unique filter that forces the background to a fixed
value. Using this filter, the real spot intensities were recovered (G)
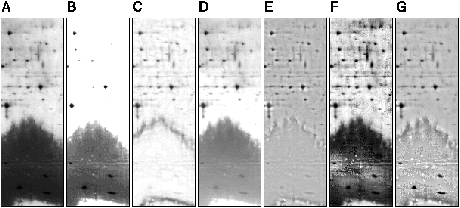
Image calibration
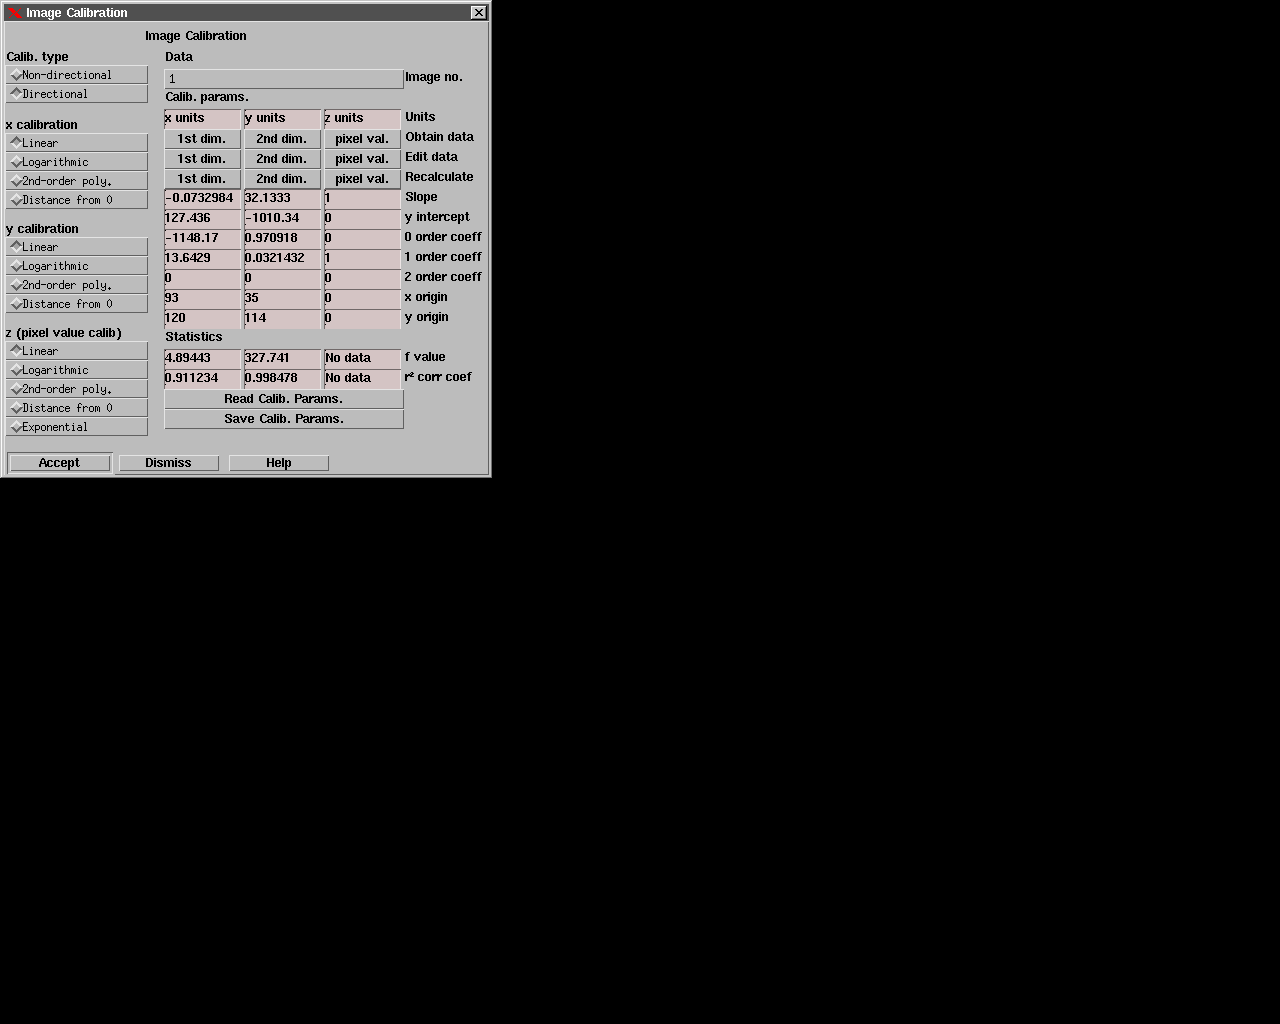
The x and y coordinates can be calibrated in two dimensions from points
on the image or a data file so that when the cursor is moved, the true
positional value of each point is displayed. The two axes need not be
orthogonal to each other or to the axes of the screen. For example, the
image could be calibrated to display both miles and kilometers, or to display
isoelectric point along a line 3 degrees from horizontal and molecular weight
along a line 75 degrees from horizontal.
The pixel value can also be calibrated. This is especially useful in
images from atomic force microscopes, where pixel values often represent
height.
Segmentation
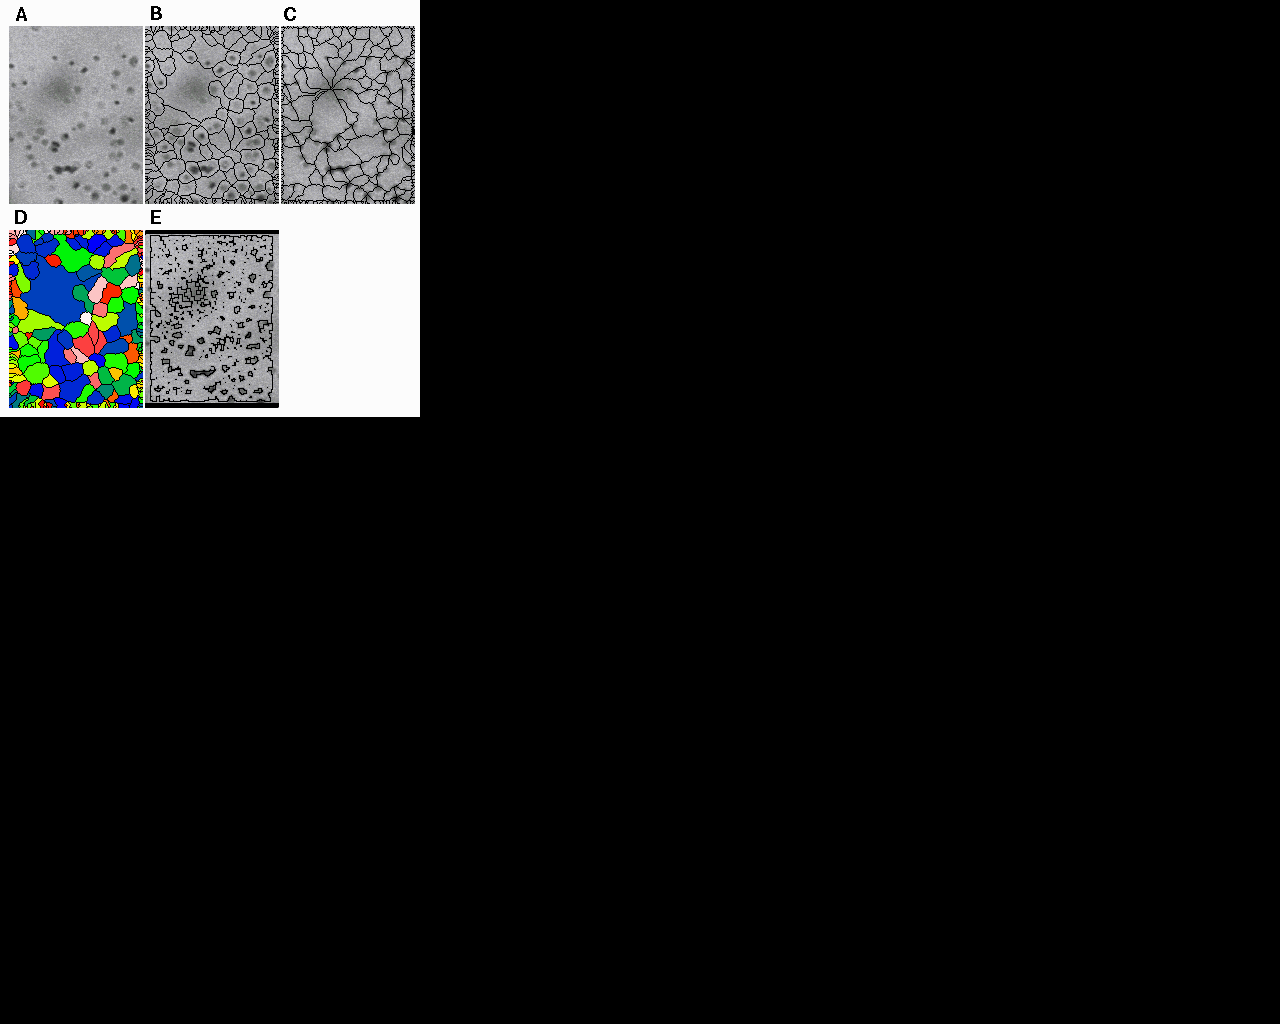
Imal can perform several types of segmentation on the image, which
can help identify features in an unbiased manner. This image shows
three types of watershed segmentation (B, C, D) and "quick
segmentation" (E).
Wavelets and 2D-FFT
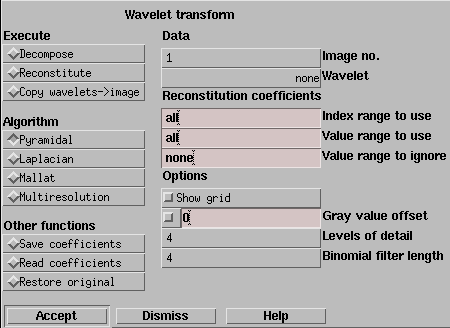
Images can be Fourier-transformed or decomposed into wavelets. A large
number of wavelets are included. For Fourier transforms, the real,
imaginary, or power spectrum can be displayed. The transformed image
can be manipulated interactively using the mouse or indirectly using
image algebra, or the values can be saved into a text file, edited, and reloaded.
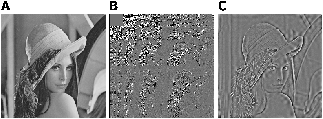
In this example, the original image (A) was decomposed into wavelets.
A portion of the wavelet coefficients was deleted using the mouse and the
image was reconstituted to produce an edge-enhanced image (C) .
3-dimensional display
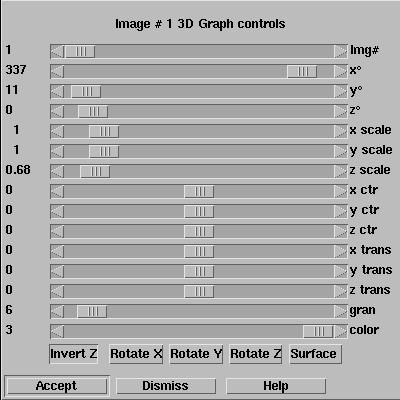
Images can be displayed as three-dimensional wireframe plots or
surface plots and rotated and scaled interactively.
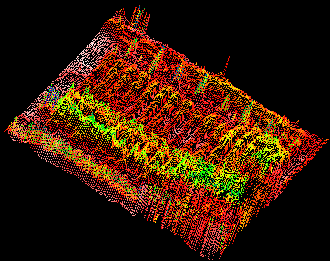
(Click on image for full-size image)
Image algebra
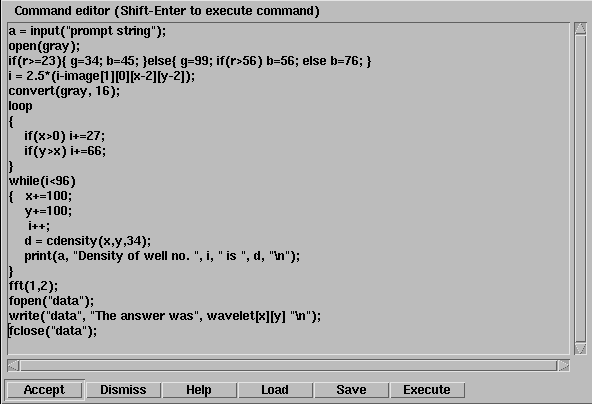
All the menu commands can also be entered as commands. imal has a
powerful built-in image processing language with a syntax similar to
C.
Area selection
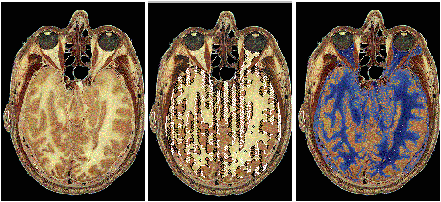
Double-clicking on an image causes imal to select features in the
image. In this example, the gray matter in an image from the Visible
Human Project was selected by double-clicking on the yellow region,
and the colors were inverted to produce the blue region at right. The
area could also have been deleted, moved, or dragged and copied onto
another image.
Grain counting
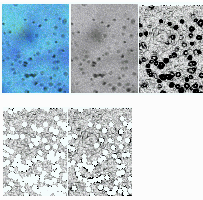
Imal can count grains, spots, or user-defined patterns in an image
using the "quick segmentation" algorithm or a neural network algorithm.
The software can annotate each identified spot on the image with its
size, coordinates, etc., or create a histogram graph or density
distribution graph automatically.
(Click on image for full-size image)
Image registration
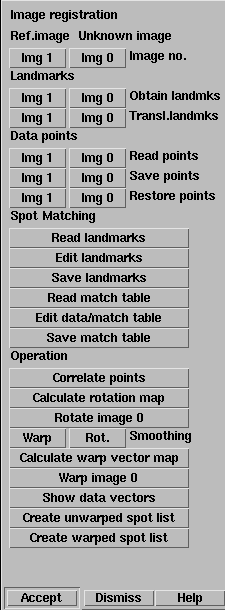
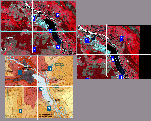
In image registration, warps, distortions, translations, rotations, size differences,
and twists are eliminated from an image in order to bring two images
into perfect alignment. In the example below, a satellite photograph of the Chernobyl
area and the Kiyevskoy Vodokhranilishche (Kiev Reservoir) in the Ukraine (top left)
was warped to align it with the map at lower left by selecting five points of
congruence. In this screenshot, the cursor was set to show multiple cross-hairs,
so that moving the mouse moves a crosshair cursor on all three images simultaneously.
This facilitates identification of corresponding points.
(Click on image for full-size image)
Imal can also acquire images directly from SCSI scanners and with appropriate
drivers, can be configured to control video cameras. Extensive documentation
demonstrates how to write plugins for imal to add additional functionality.
Return to home page
This site is maintained by


